Documentation
Introduction
Stocky is designed to help solve the fundamental problem every investor is faced with. Given the thousands of Instruments available for investing, and a finite fund of cash to invest, how can I choose the best opportunities for investment.
To help with this task, Stocky fetches market data, both current and historical, and uses it to present a view of the collected Instruments, with key metrics allowing for filtering and selection.
Instruments
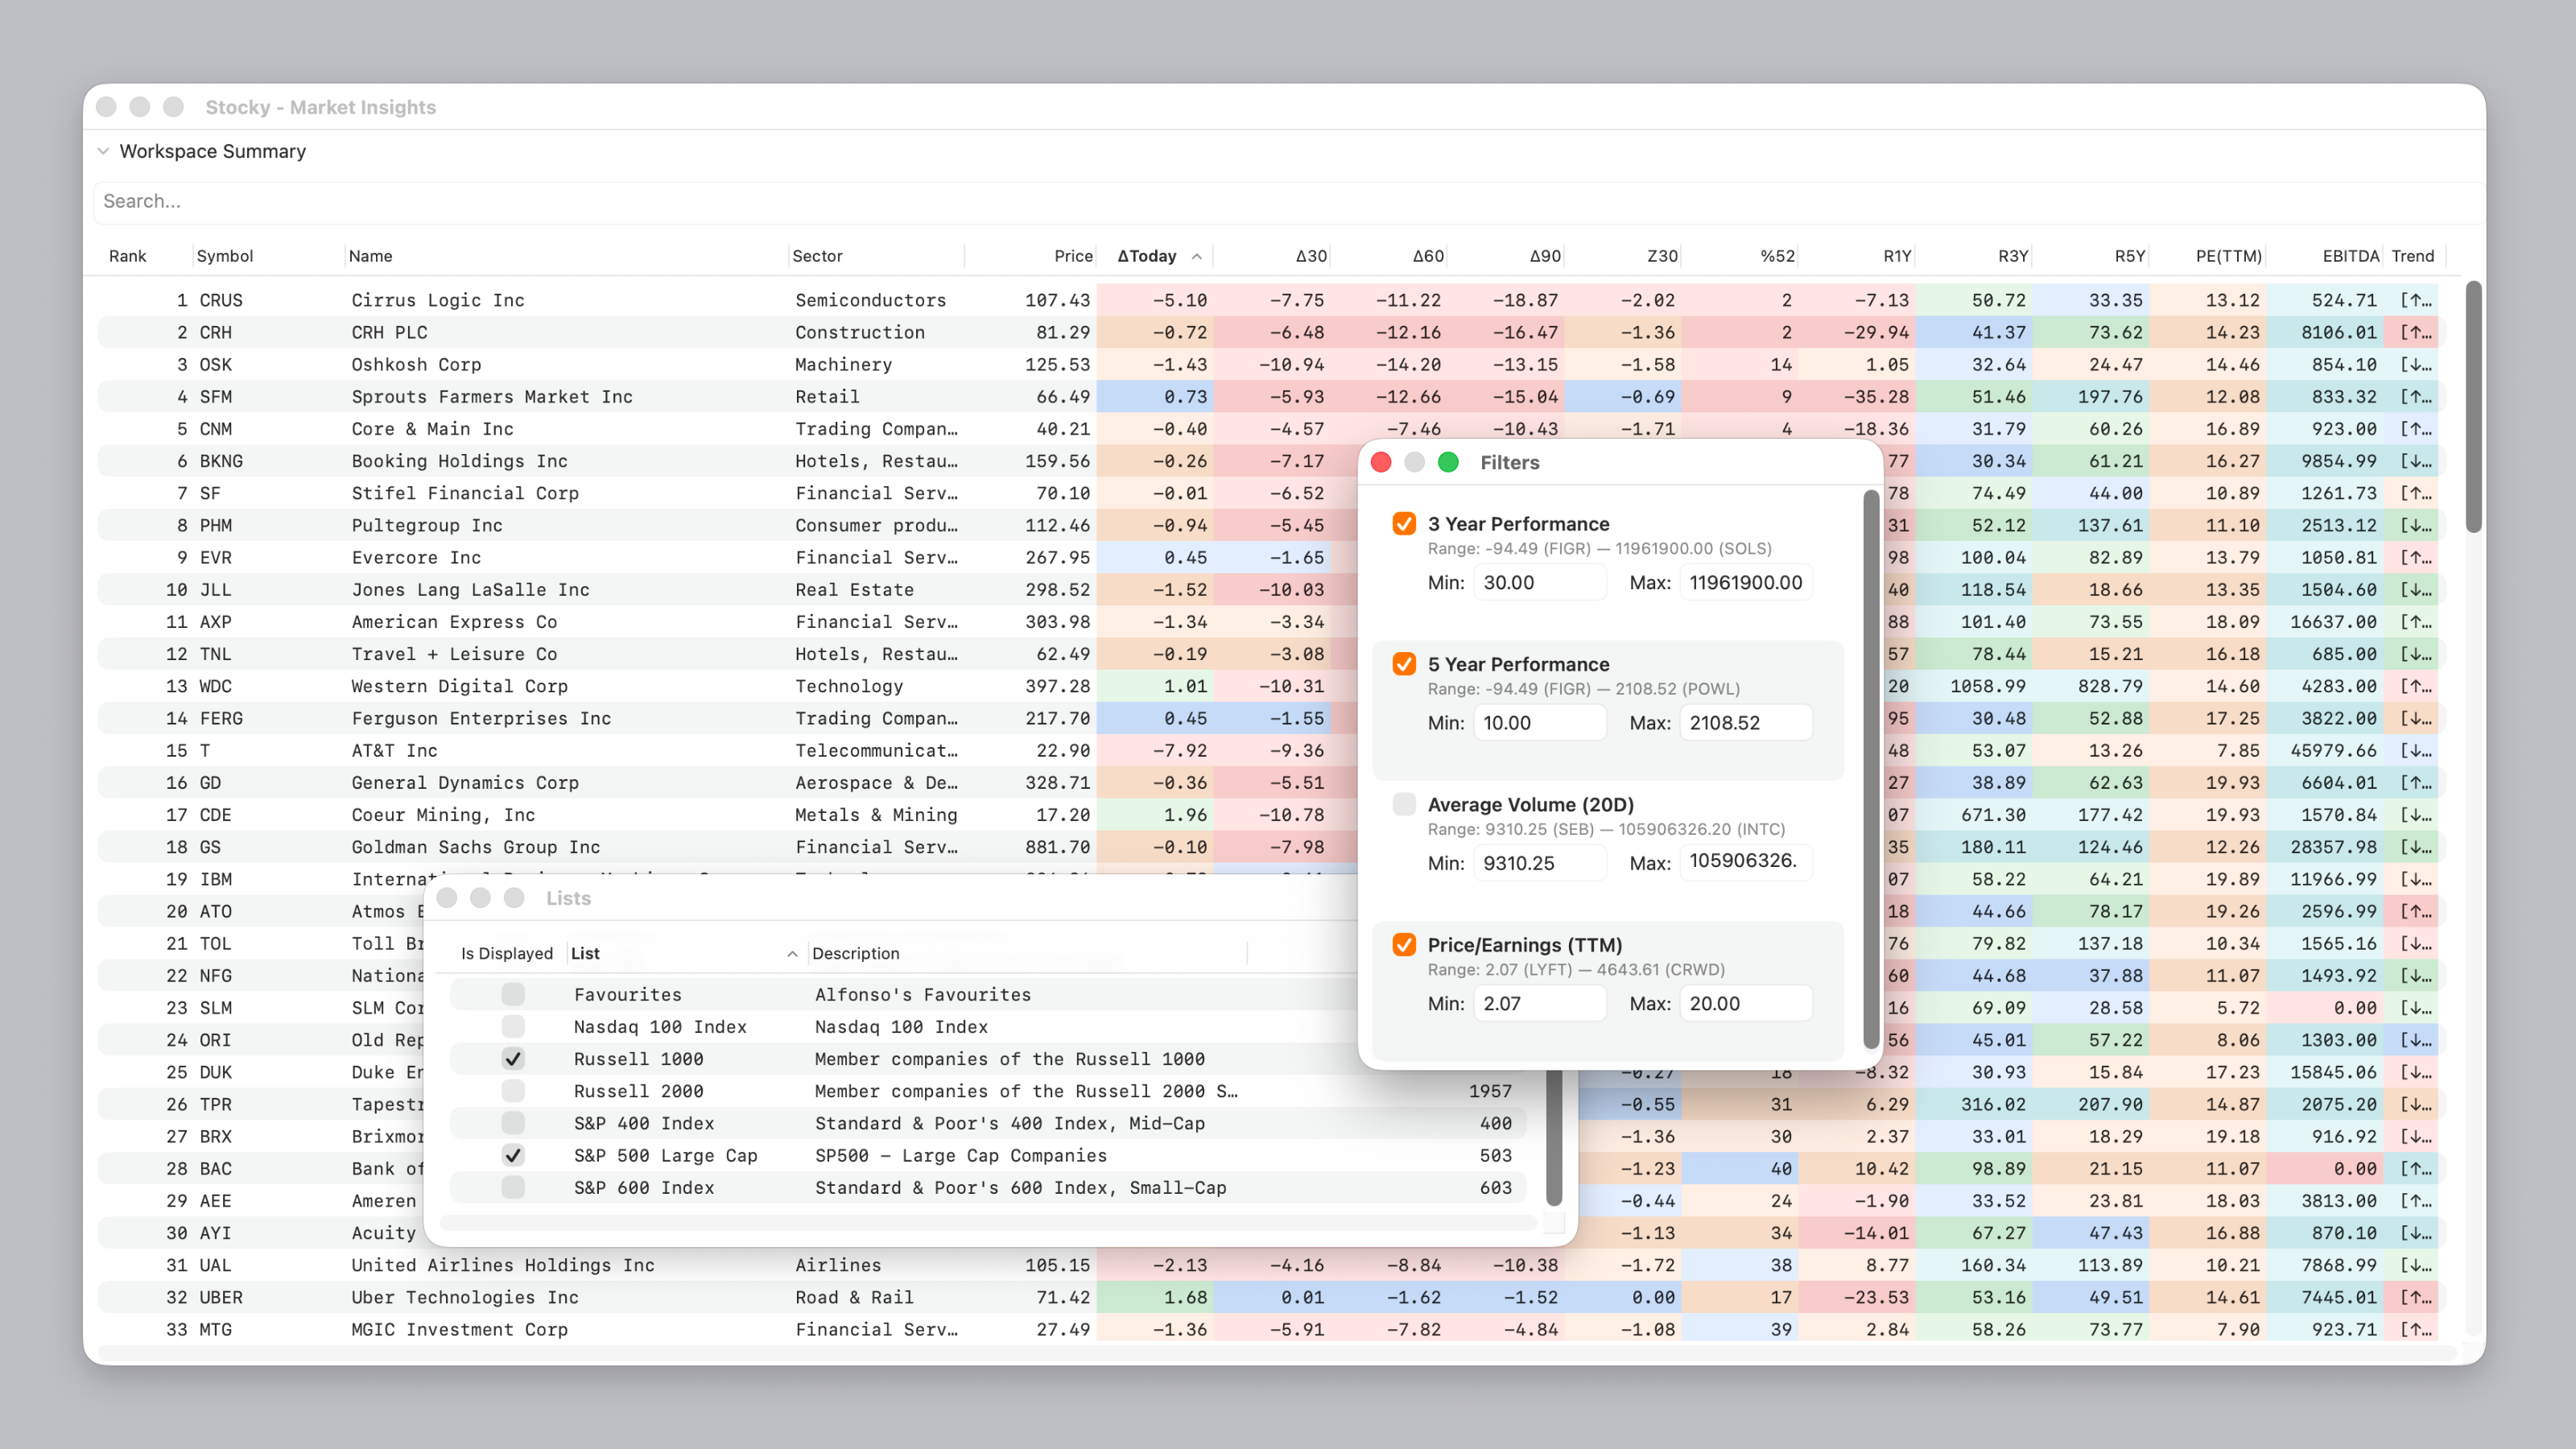
An Instrument is a financial instrument traded on the stock market. Instruments are displayed in the workspace grid and have the following columns:
- Rank - a number representing the position of the Instrument after scoring / ranking
- Symbol - the ticker symbol of the Instrument
- Name - the name of the company
- Sector - the sector that the company operates in (Technology, Retail, etc.)
- Price - the current price of the Instrument.
- ΔToday, Δ30, Δ60 & Δ90 - the current price's percentage change vs. Today, vs. the 30, 60 and 90 day moving average windows respectively.
- Z30 - the number of standard deviations from the 30-day mean
- %52 - where the current price is relative to its 52 week spread. A value of 50 would indicate that the Instrument's current price is exactly halfway between the 52-week high and the 52 week low.
- R1Y, R3Y, R5Y - the Instrument's return over a 1, 3 and 5 year period.
- PE(TTM) - the price-to-earnings ratio based on earnings from the Trailing Twelve Months (TTM)
- EBITDA - Earnings Before Interest, Taxes, Depreciation, and Amortization.
- Trend - a representation of the probability of movement based on the previous occurrences of a similar 5 day sliding window.
Lists
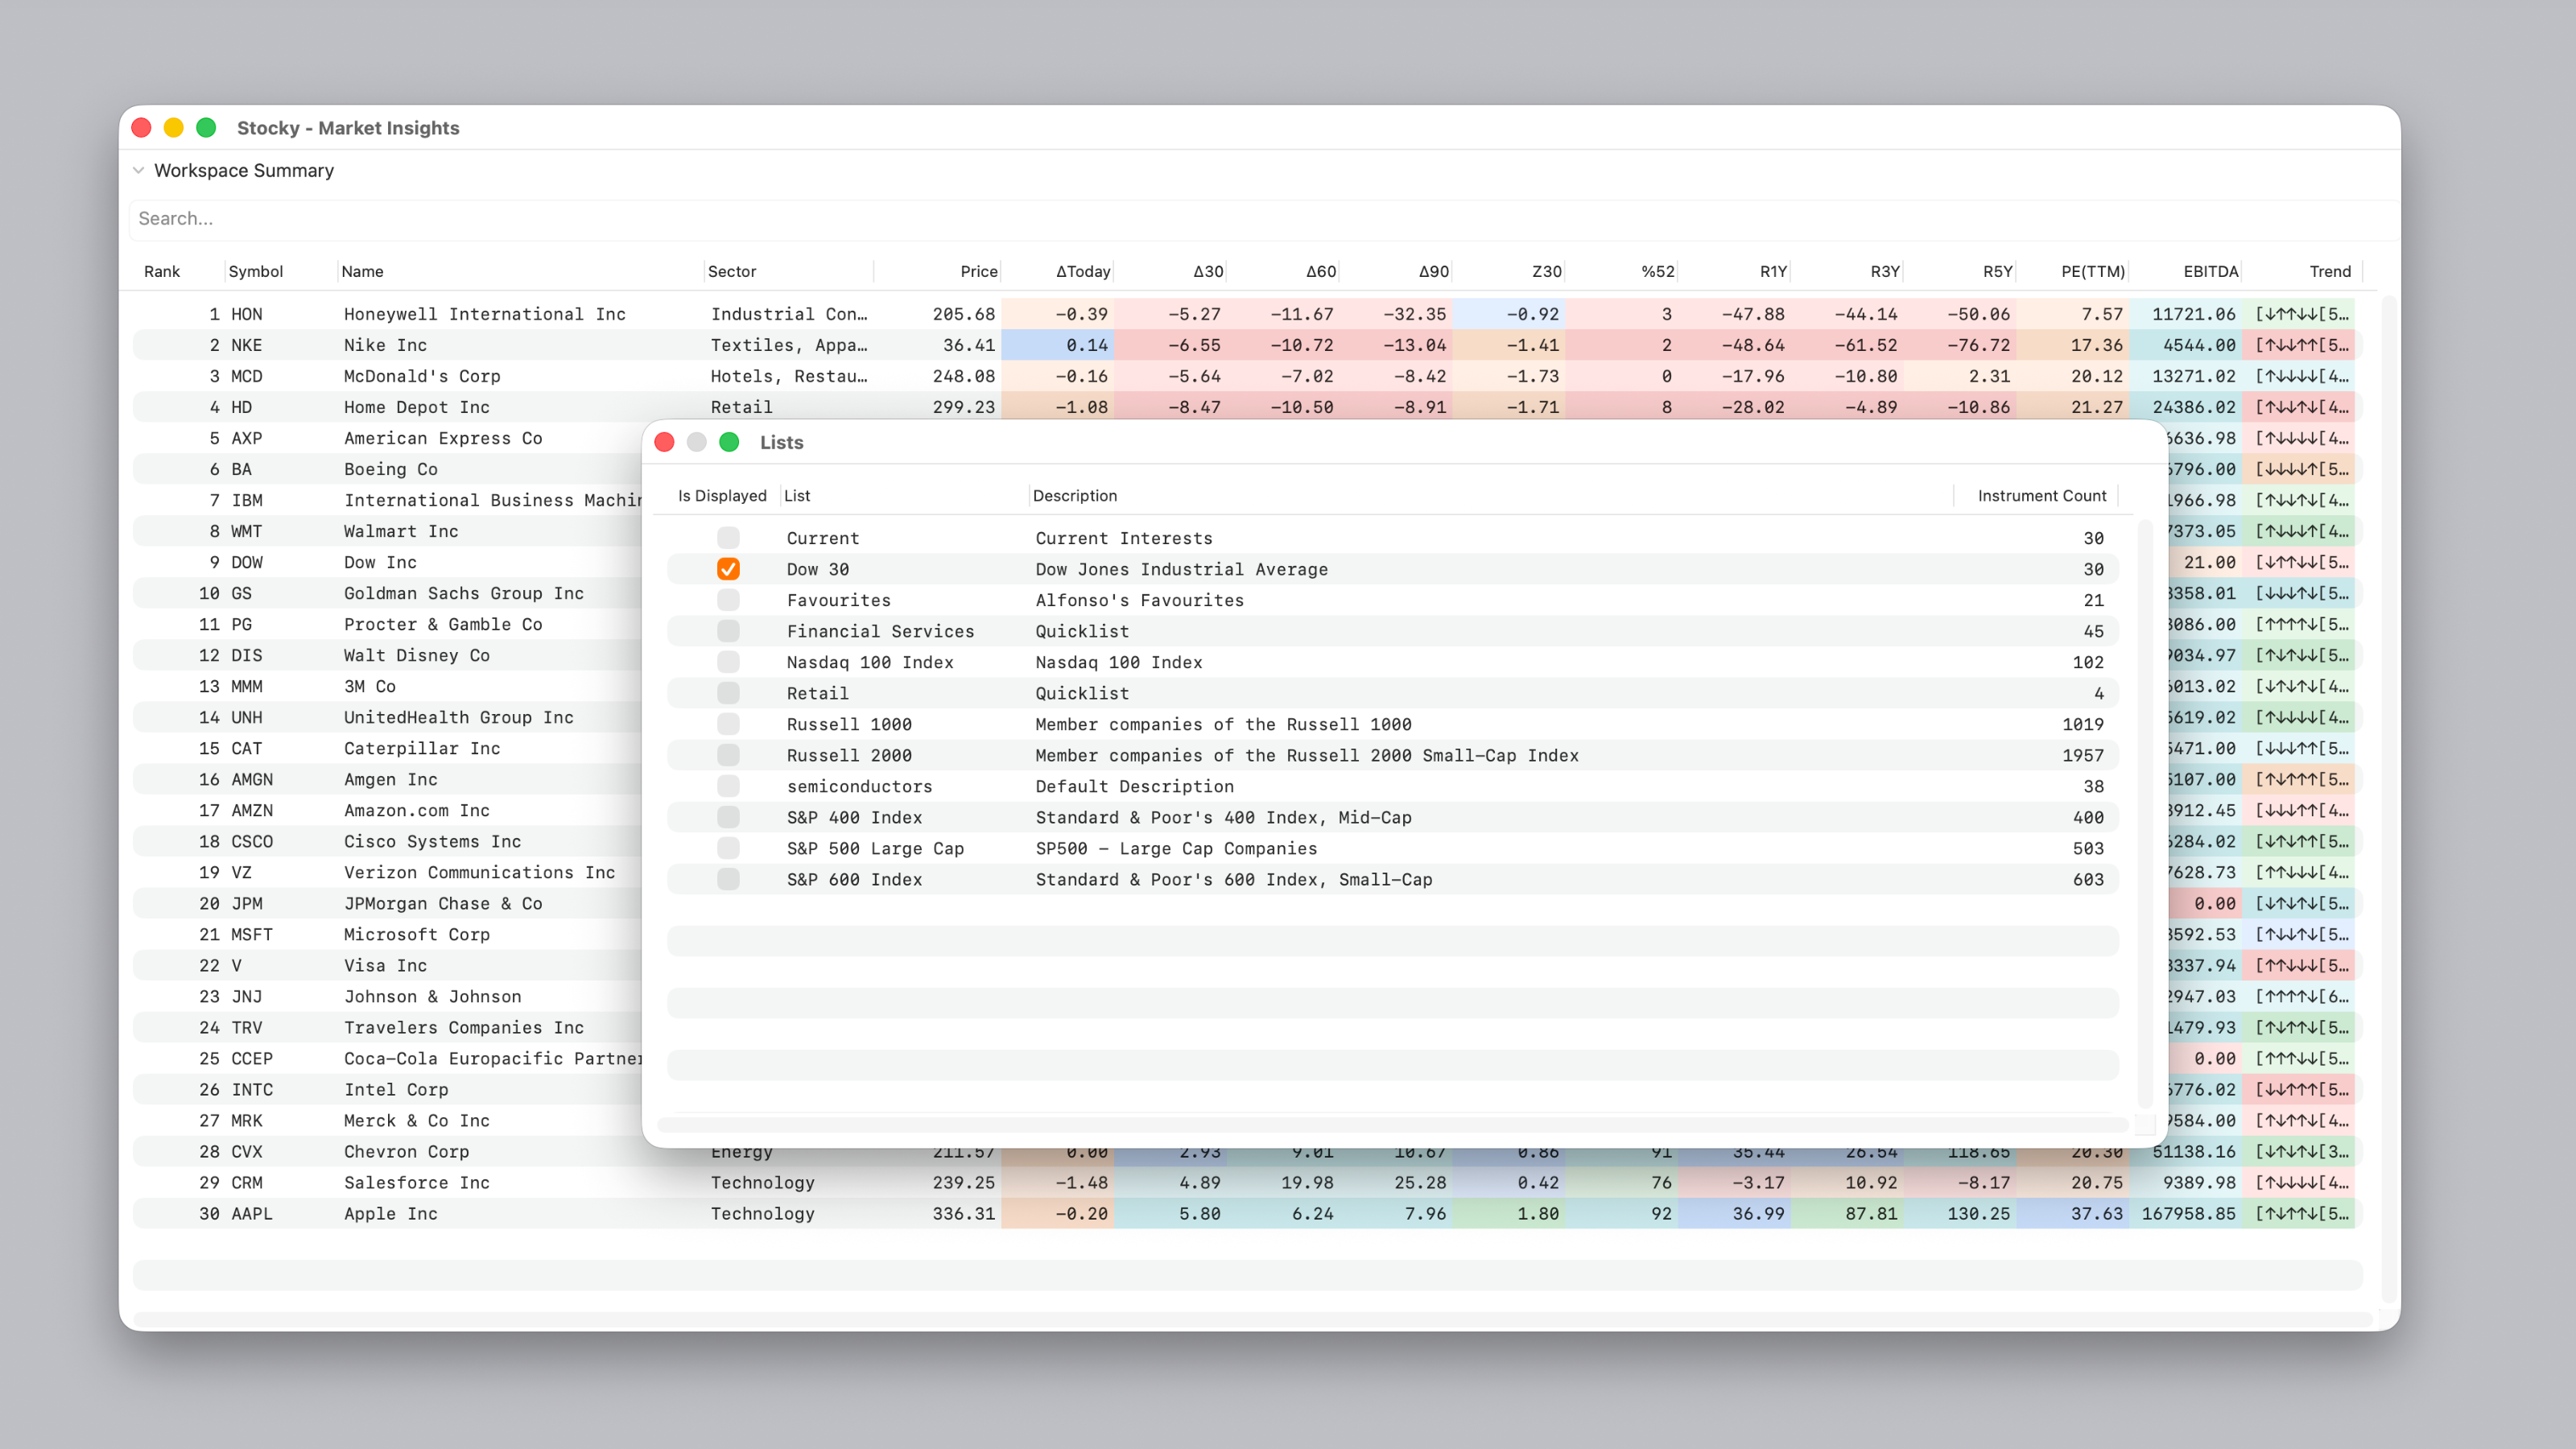
Lists are the fundamental organizational unit of Stocky. Instruments are organized into collections, called Lists. Workspaces are used to view Lists, and a workspace may contain 1 or more Lists.
A standard collection of Lists (SP500, Russel1000, DOW30, etc.) is provided by default, and users can add / delete / modify Lists as needed.
List Management
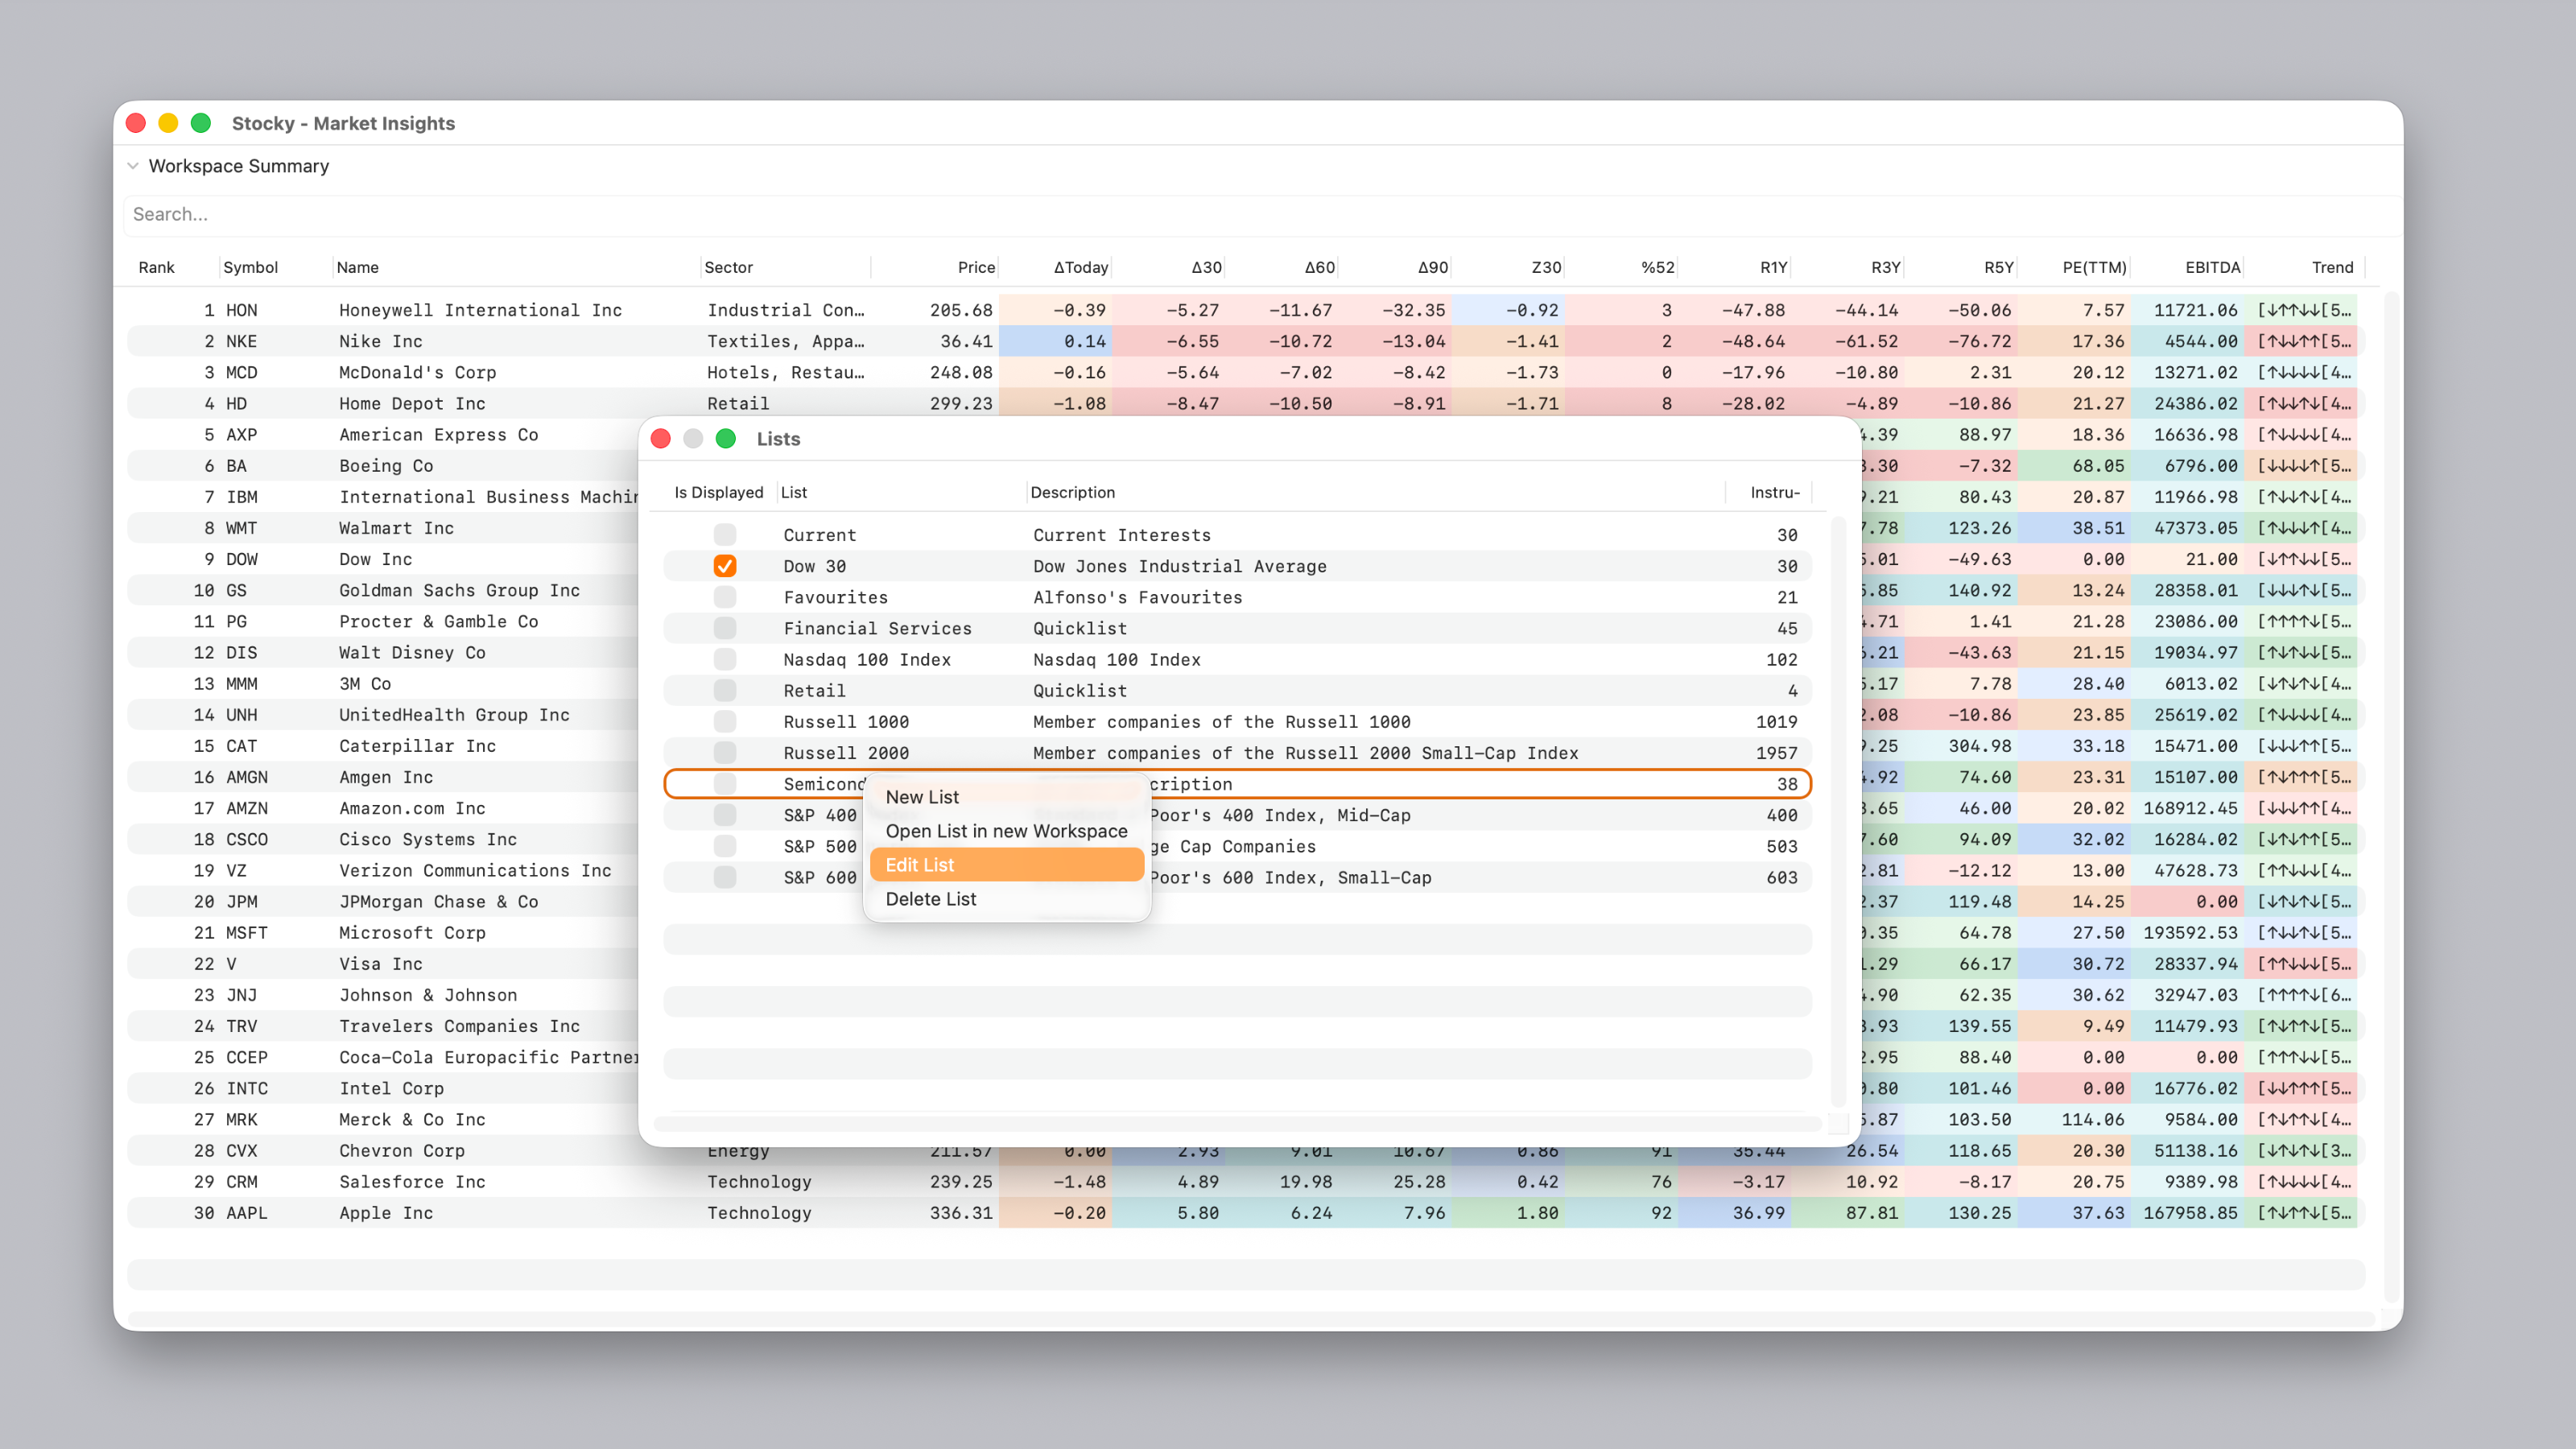
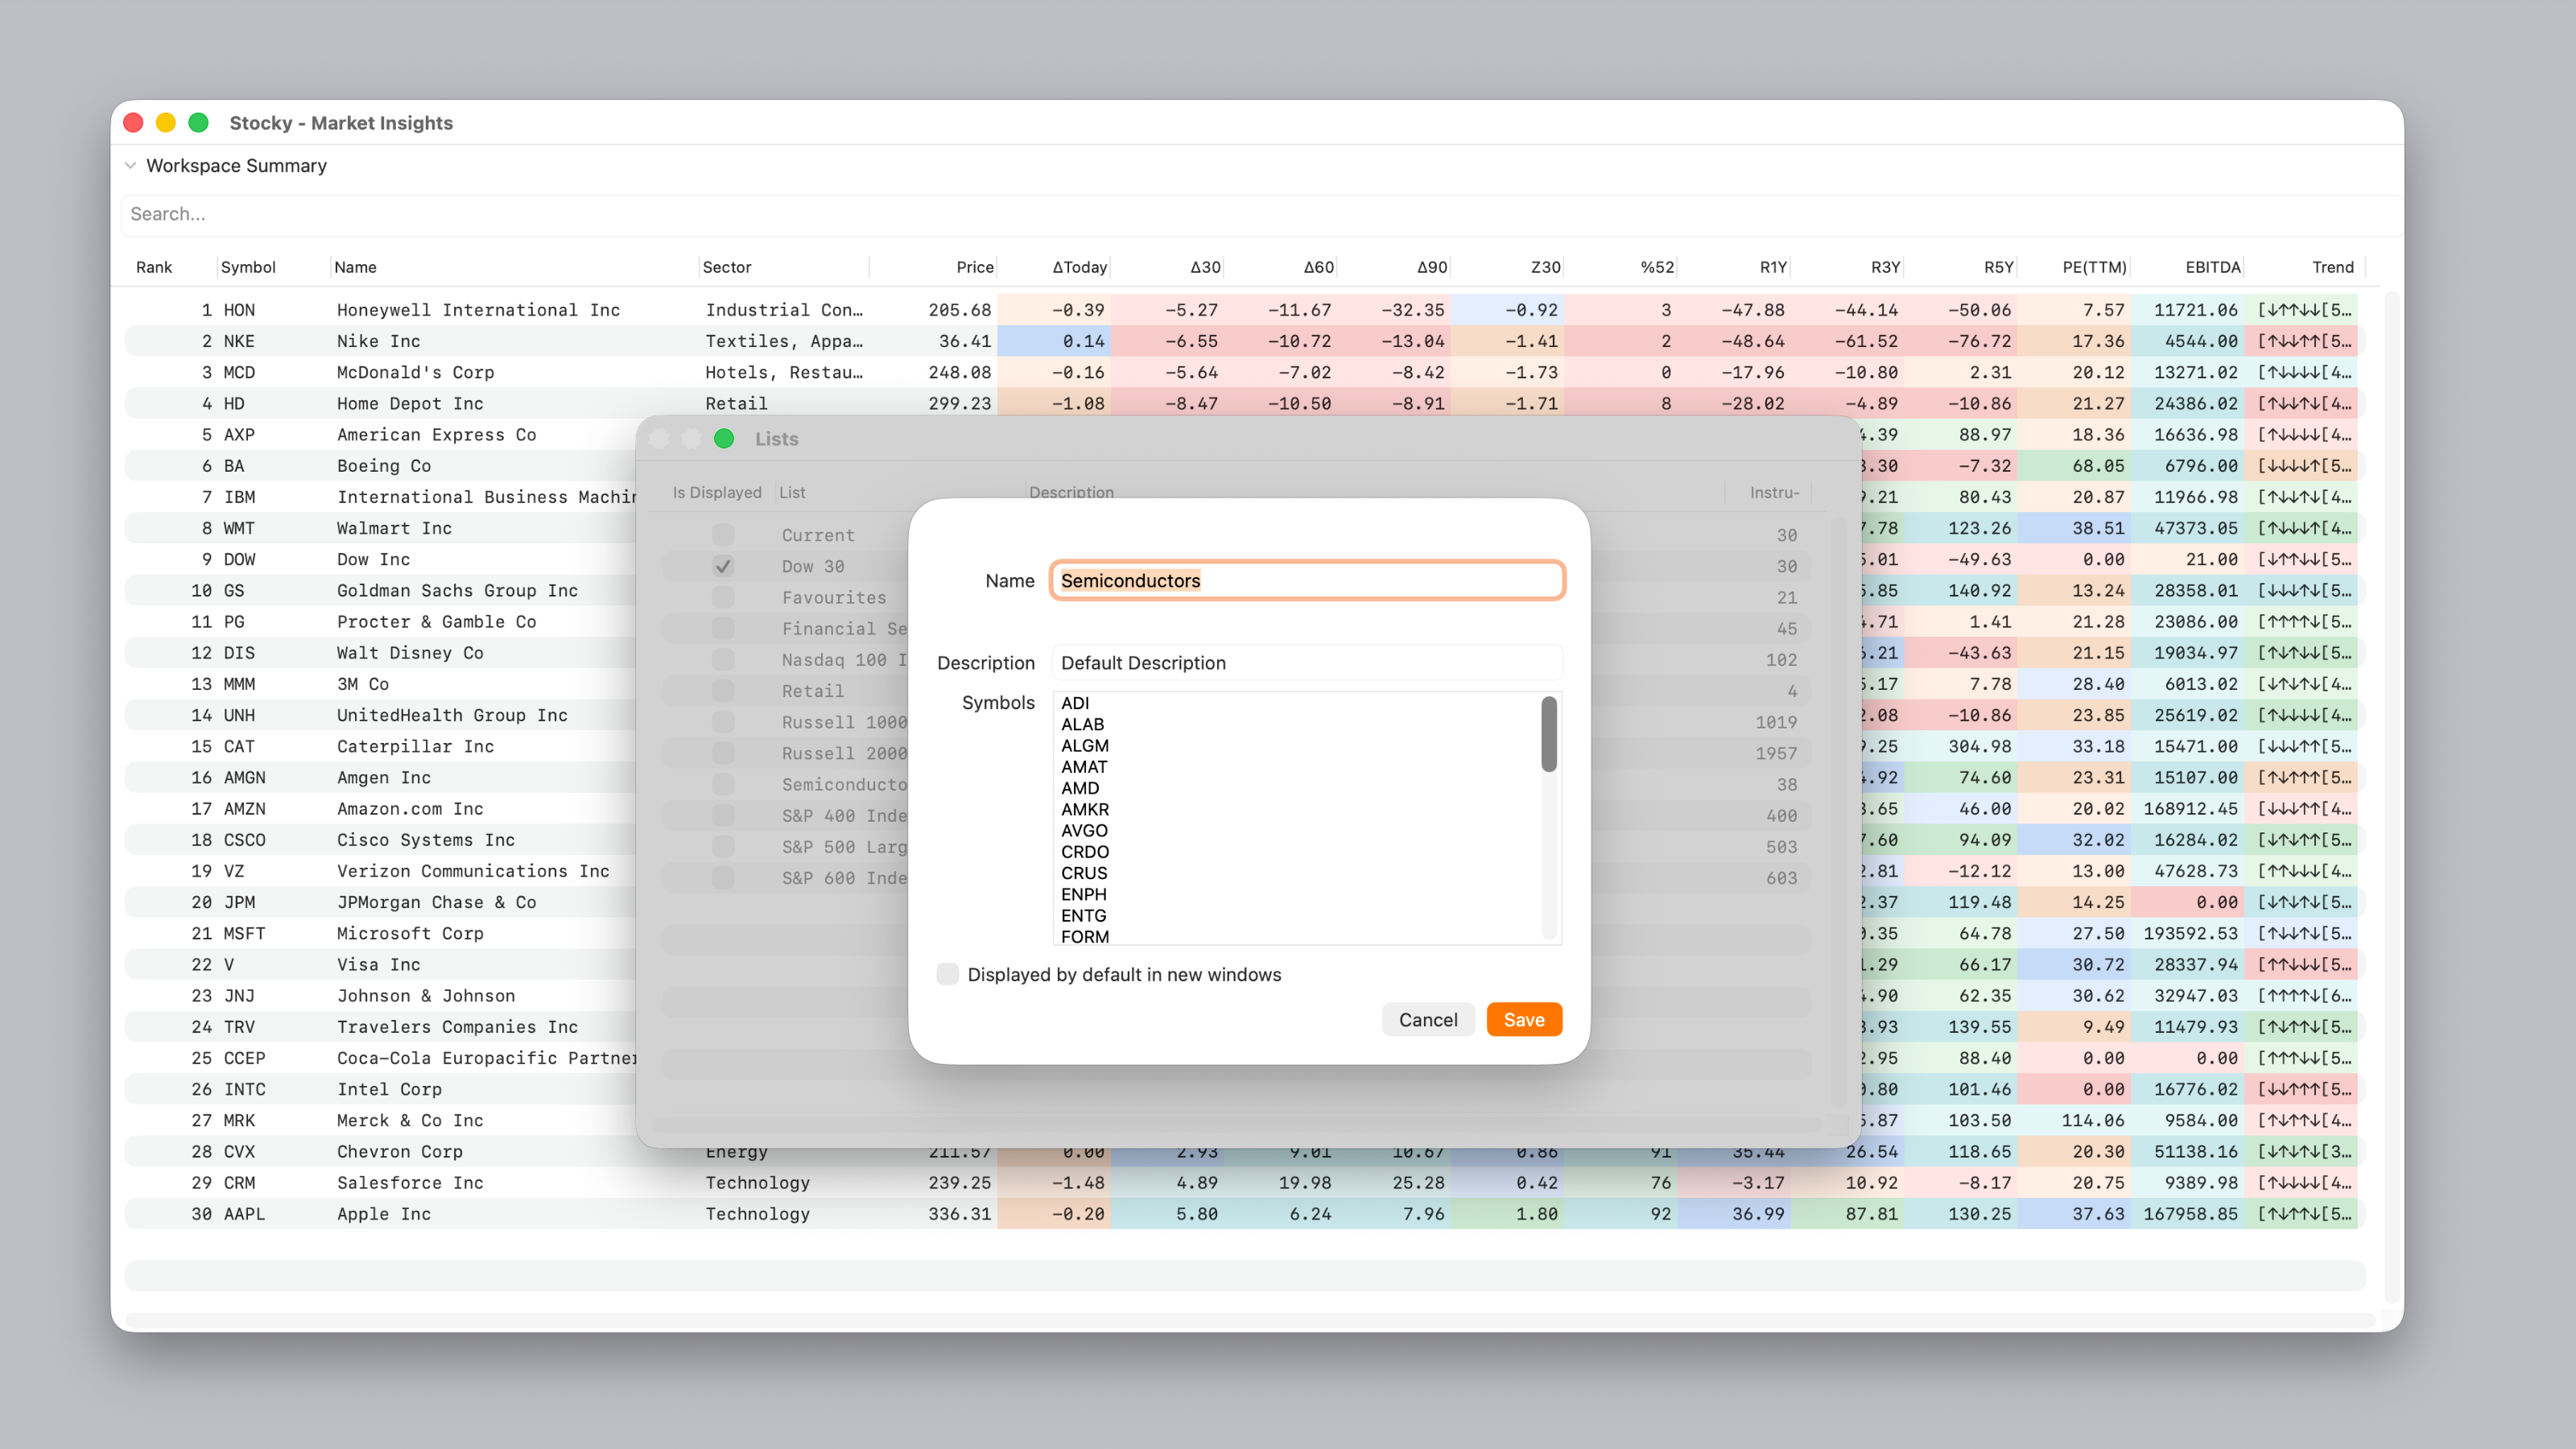
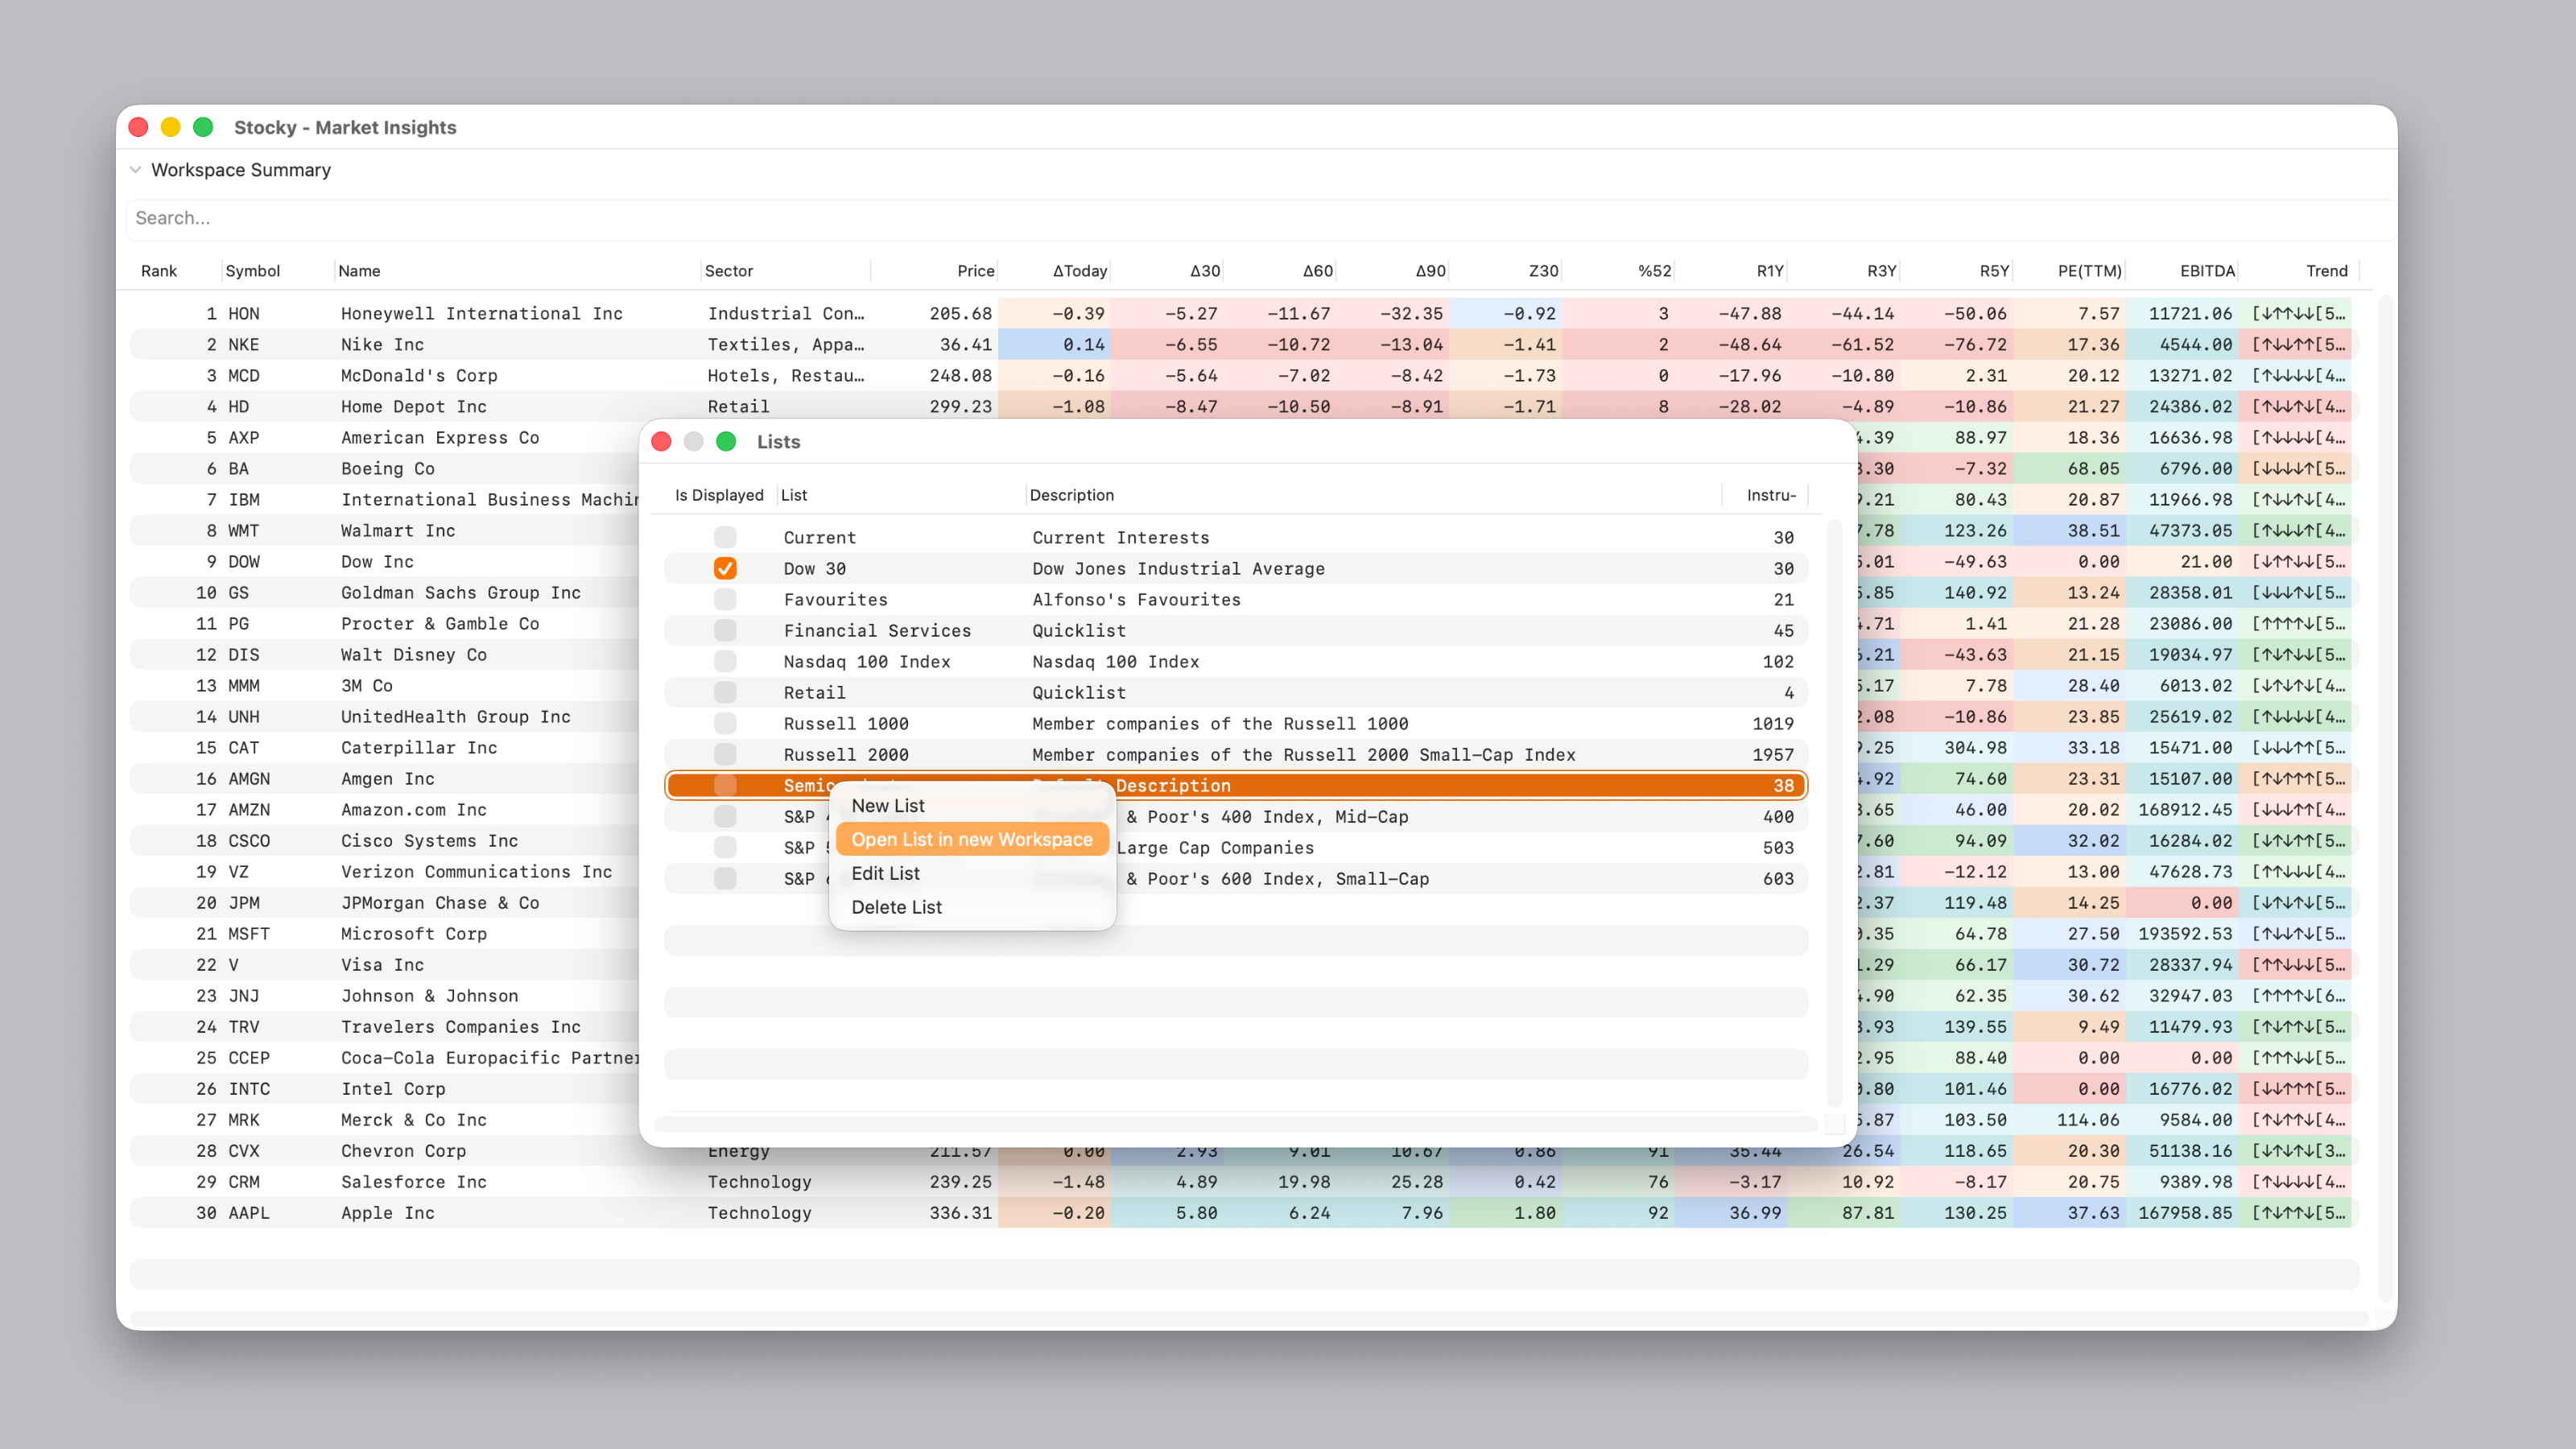
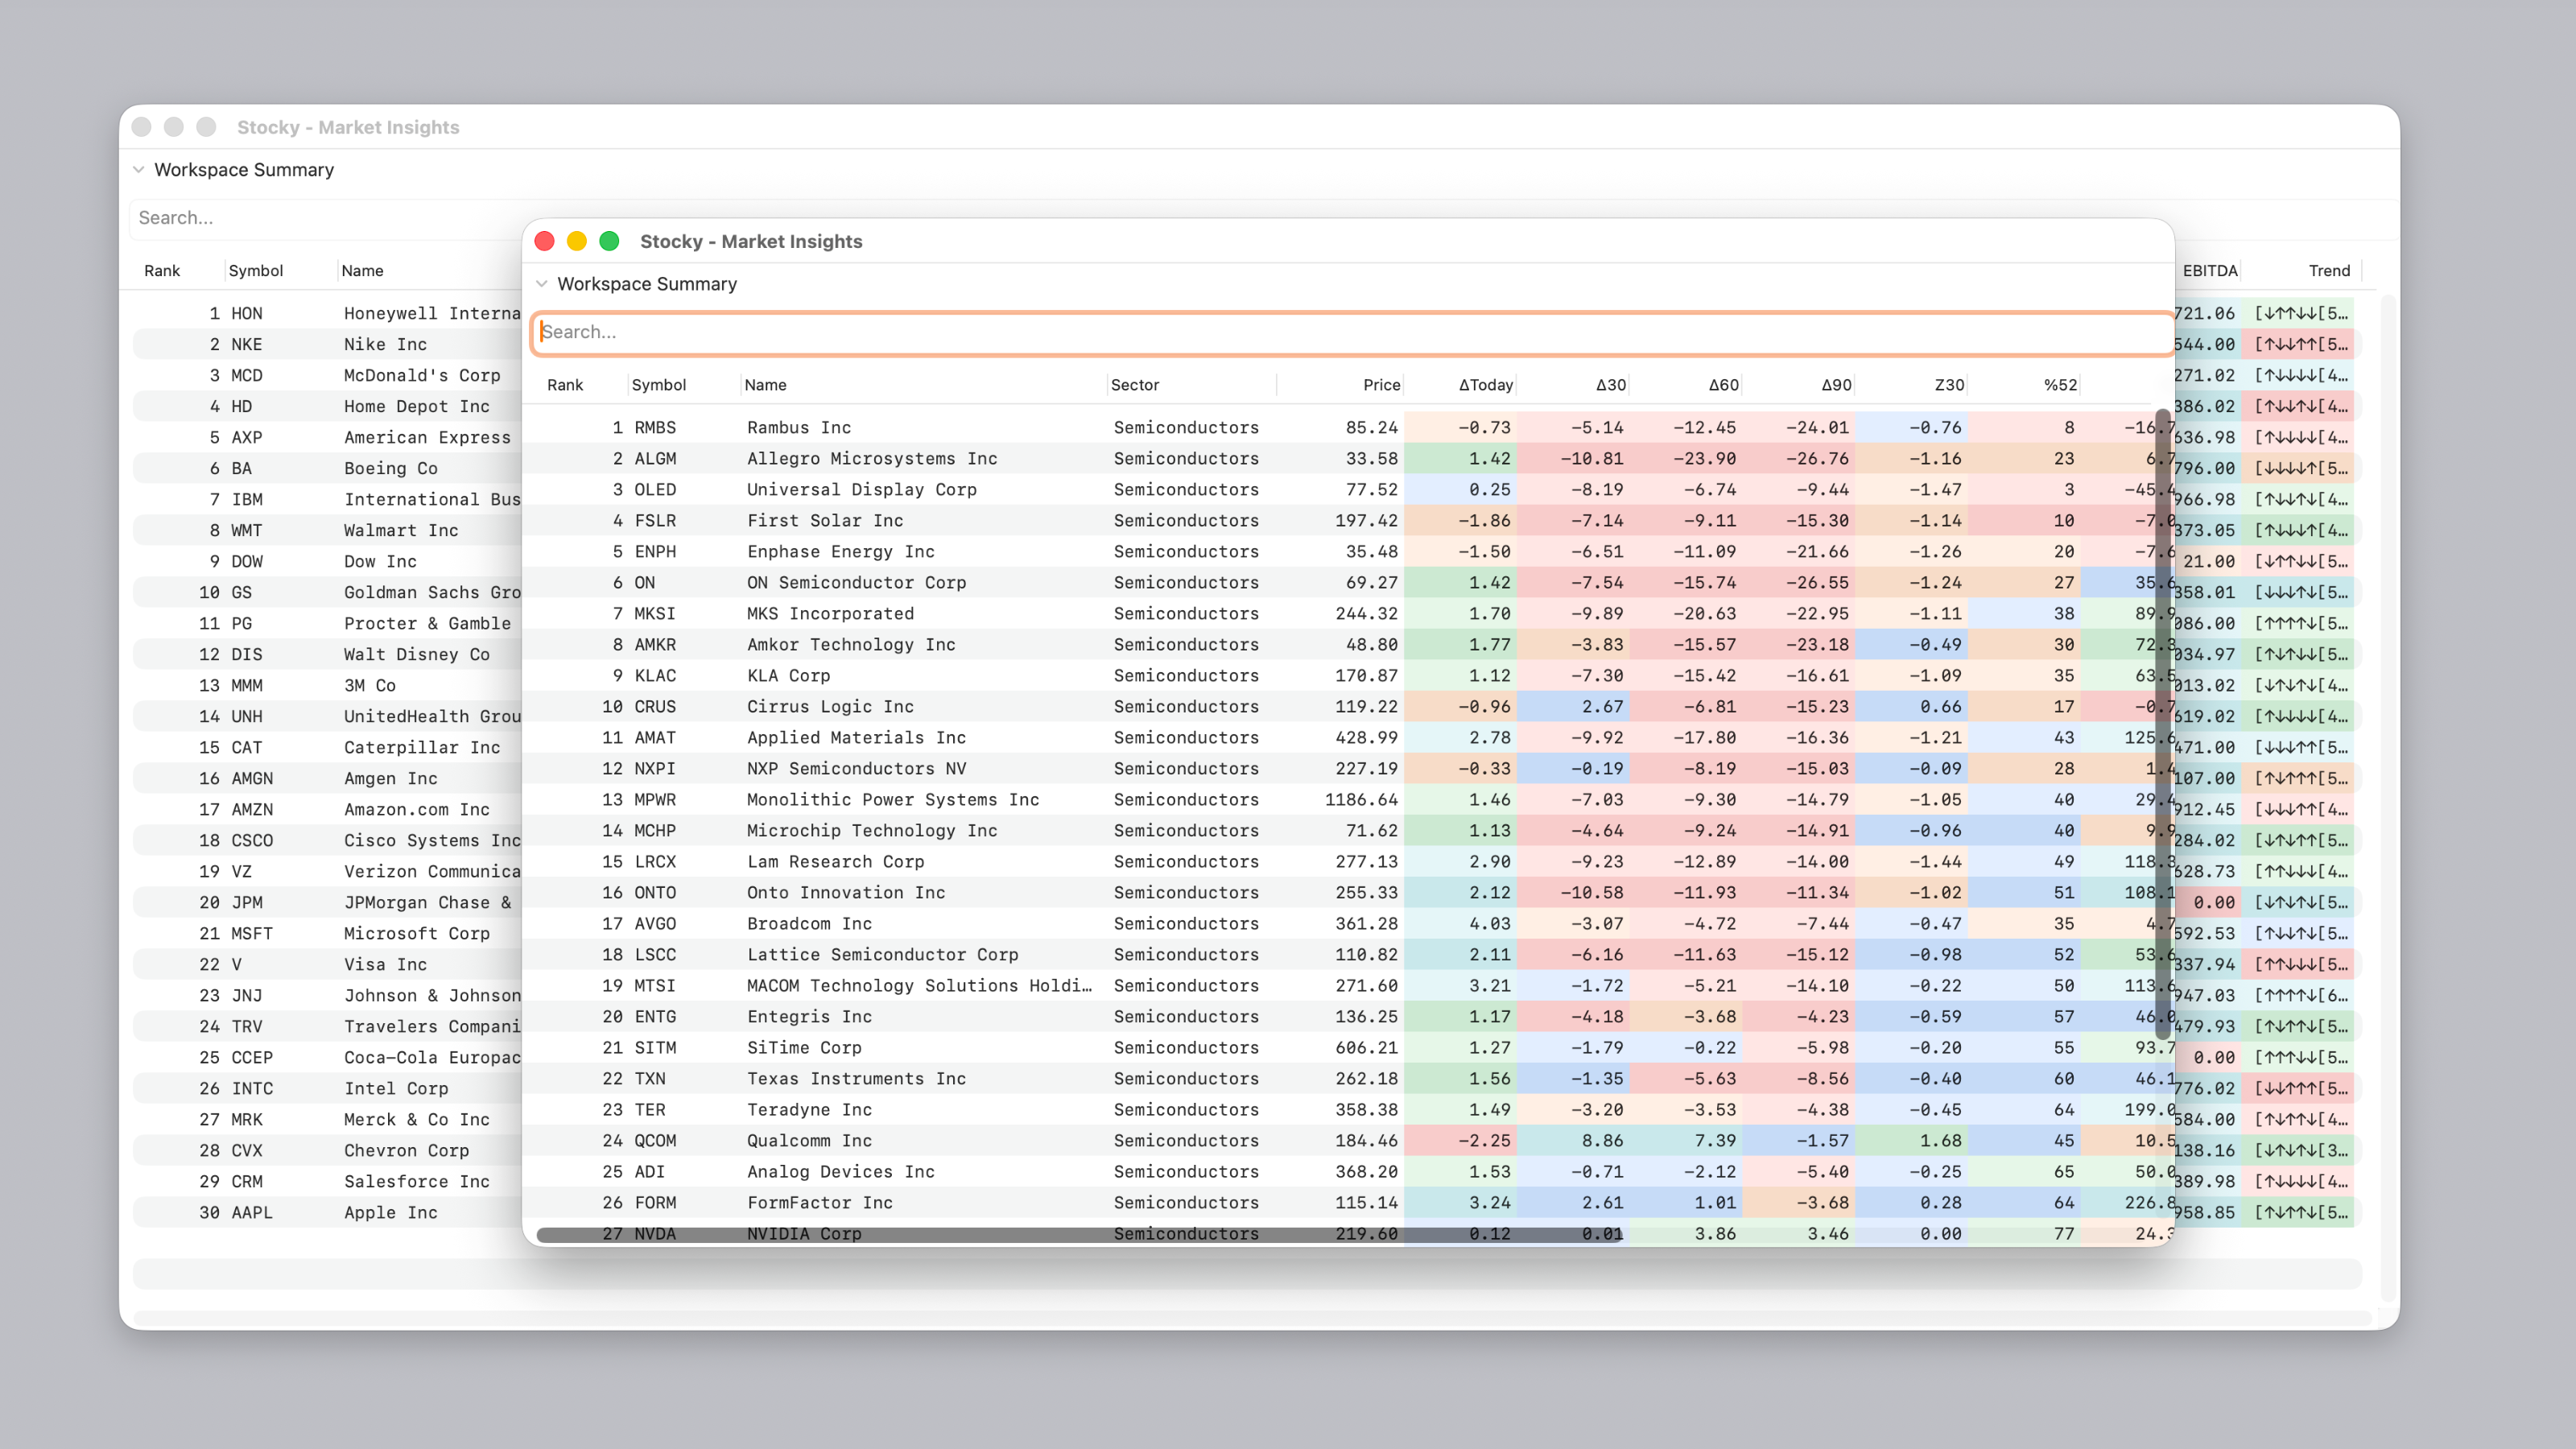
Lists can be created at any time directly from the Workspace browser, allowing you to track investment candidates for later, more careful consideration.
Workspaces
Lists are organized into Workspaces in the same way that Instruments are organized into Lists. The Russel 3000 for example, is the combination of the Russell 1000 and the Russell 2000.
Stocky allows the user to to combine Lists into a Workspace allowing Instruments to be filtered and selected.
The example below shows a Workspace combining Instruments from selected market-sector Lists into a single view for ranking and analysis.
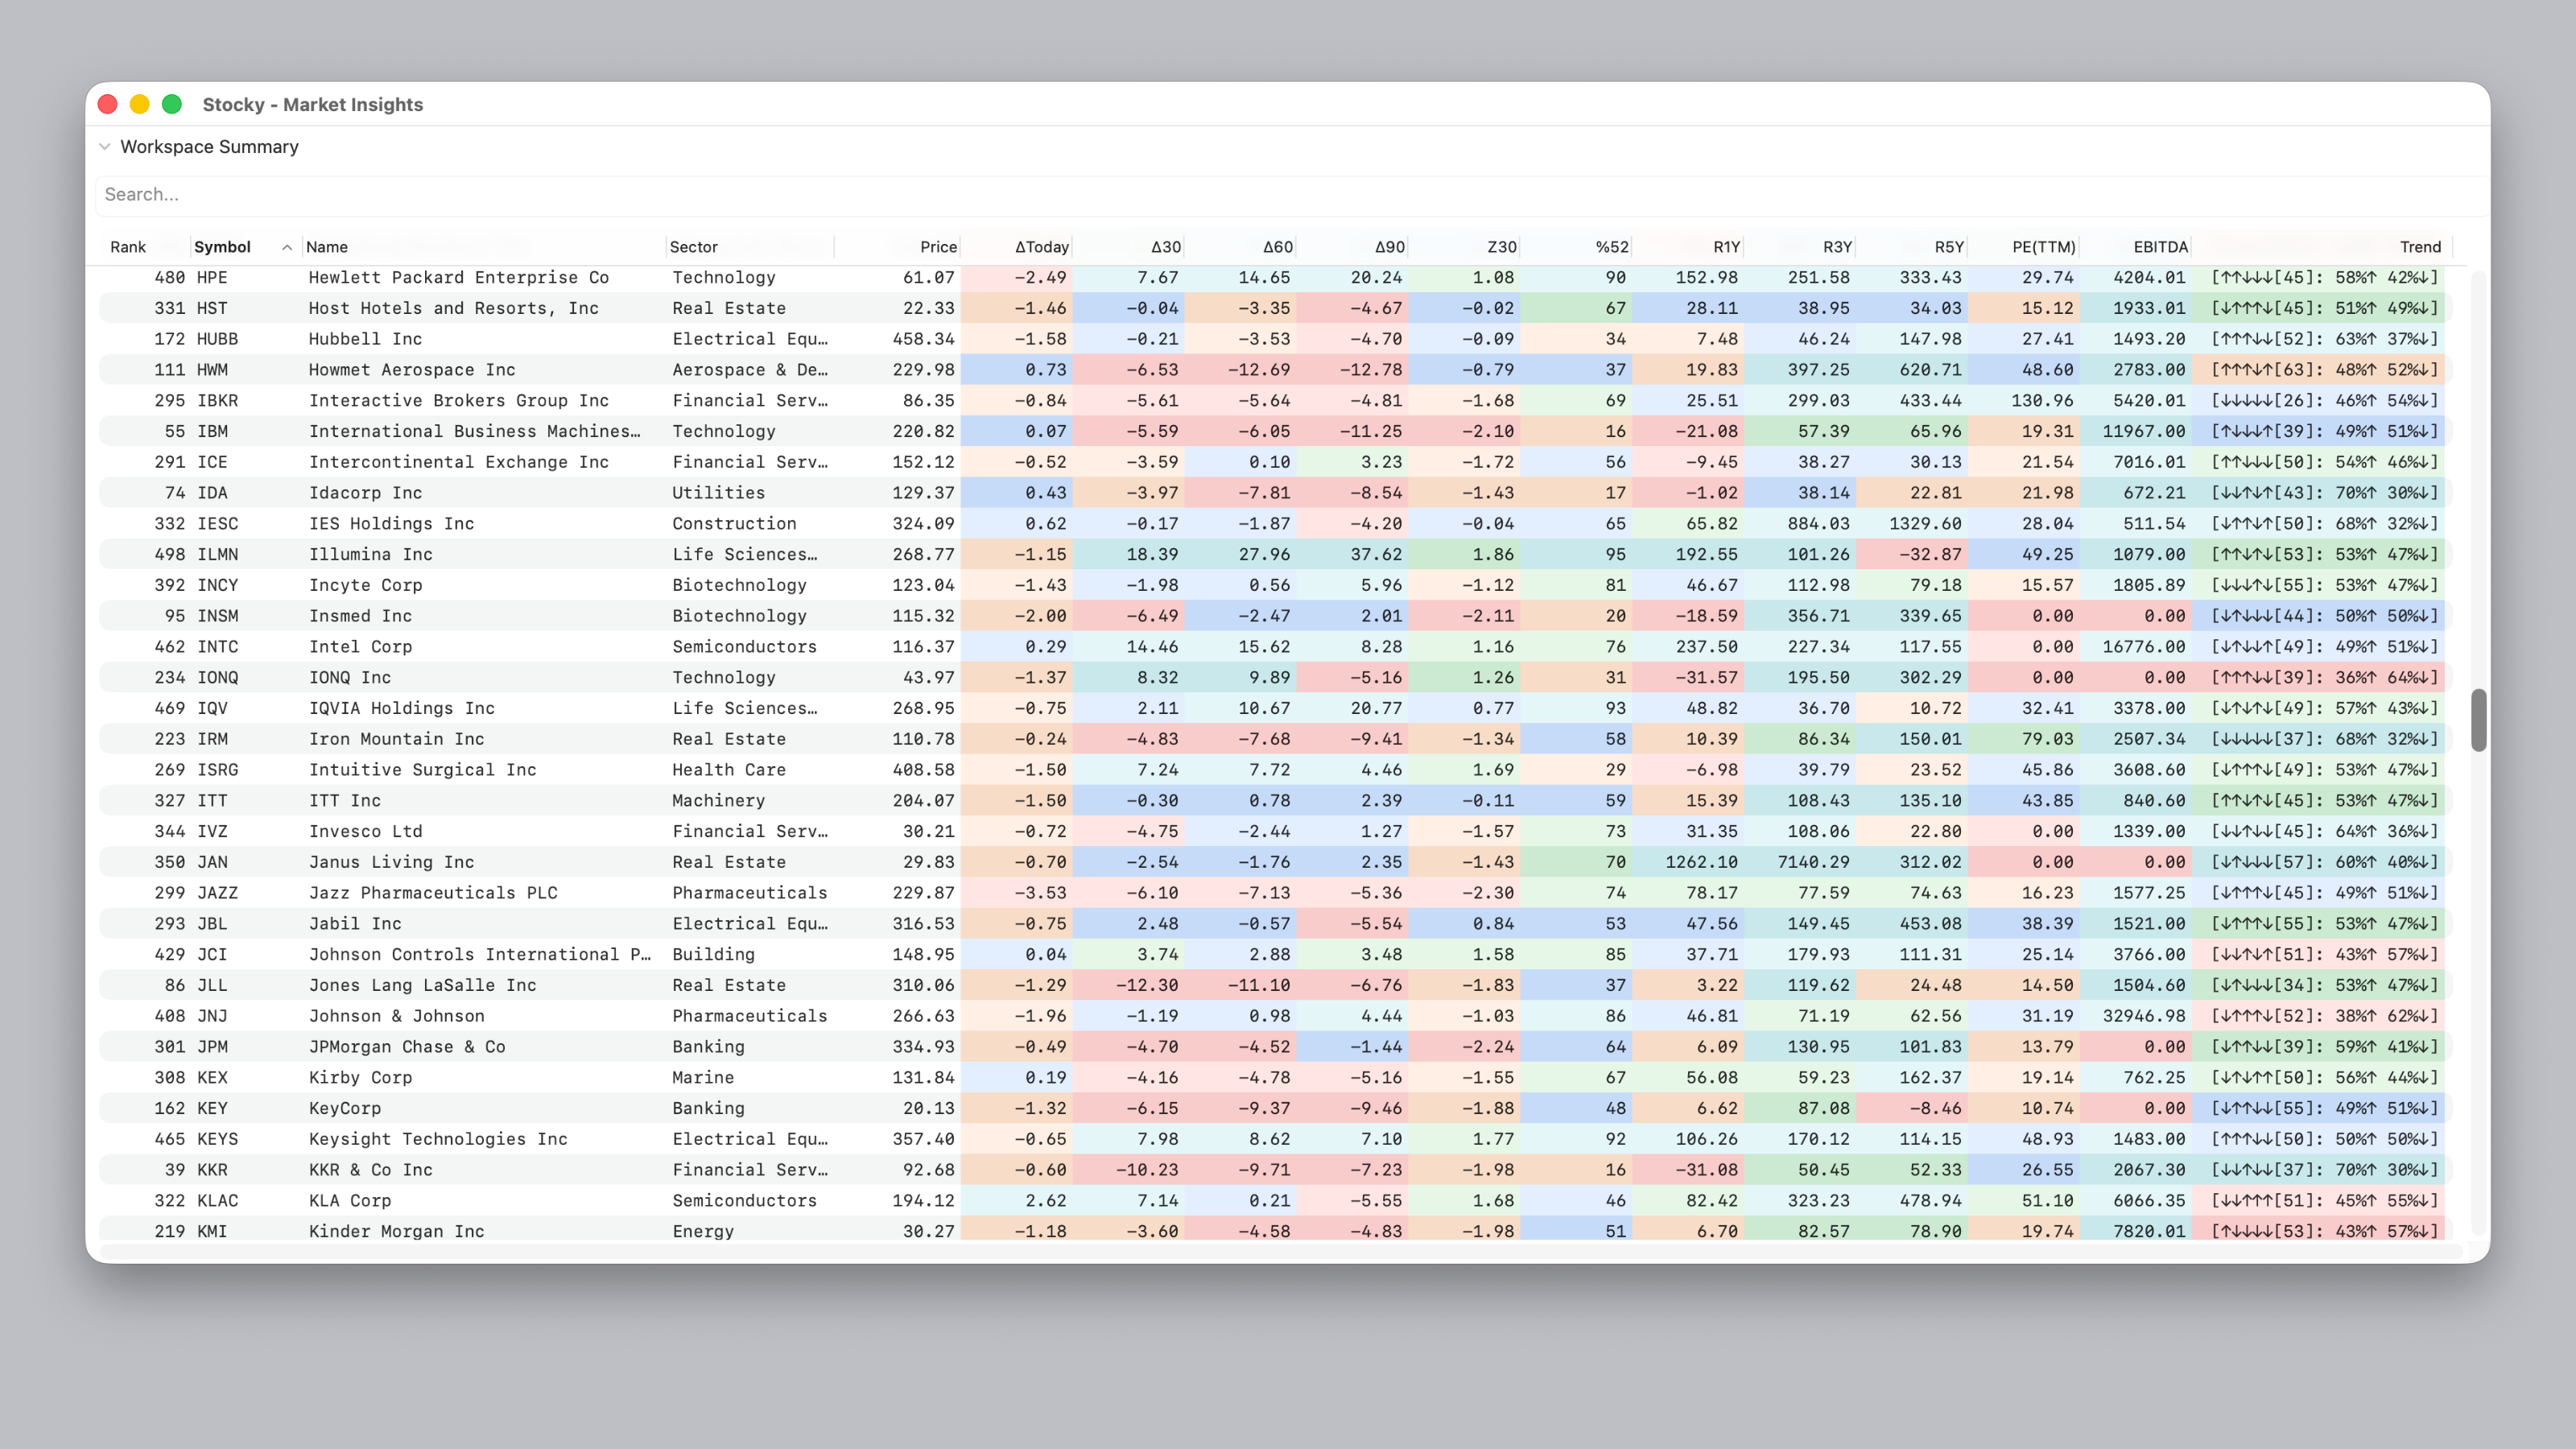
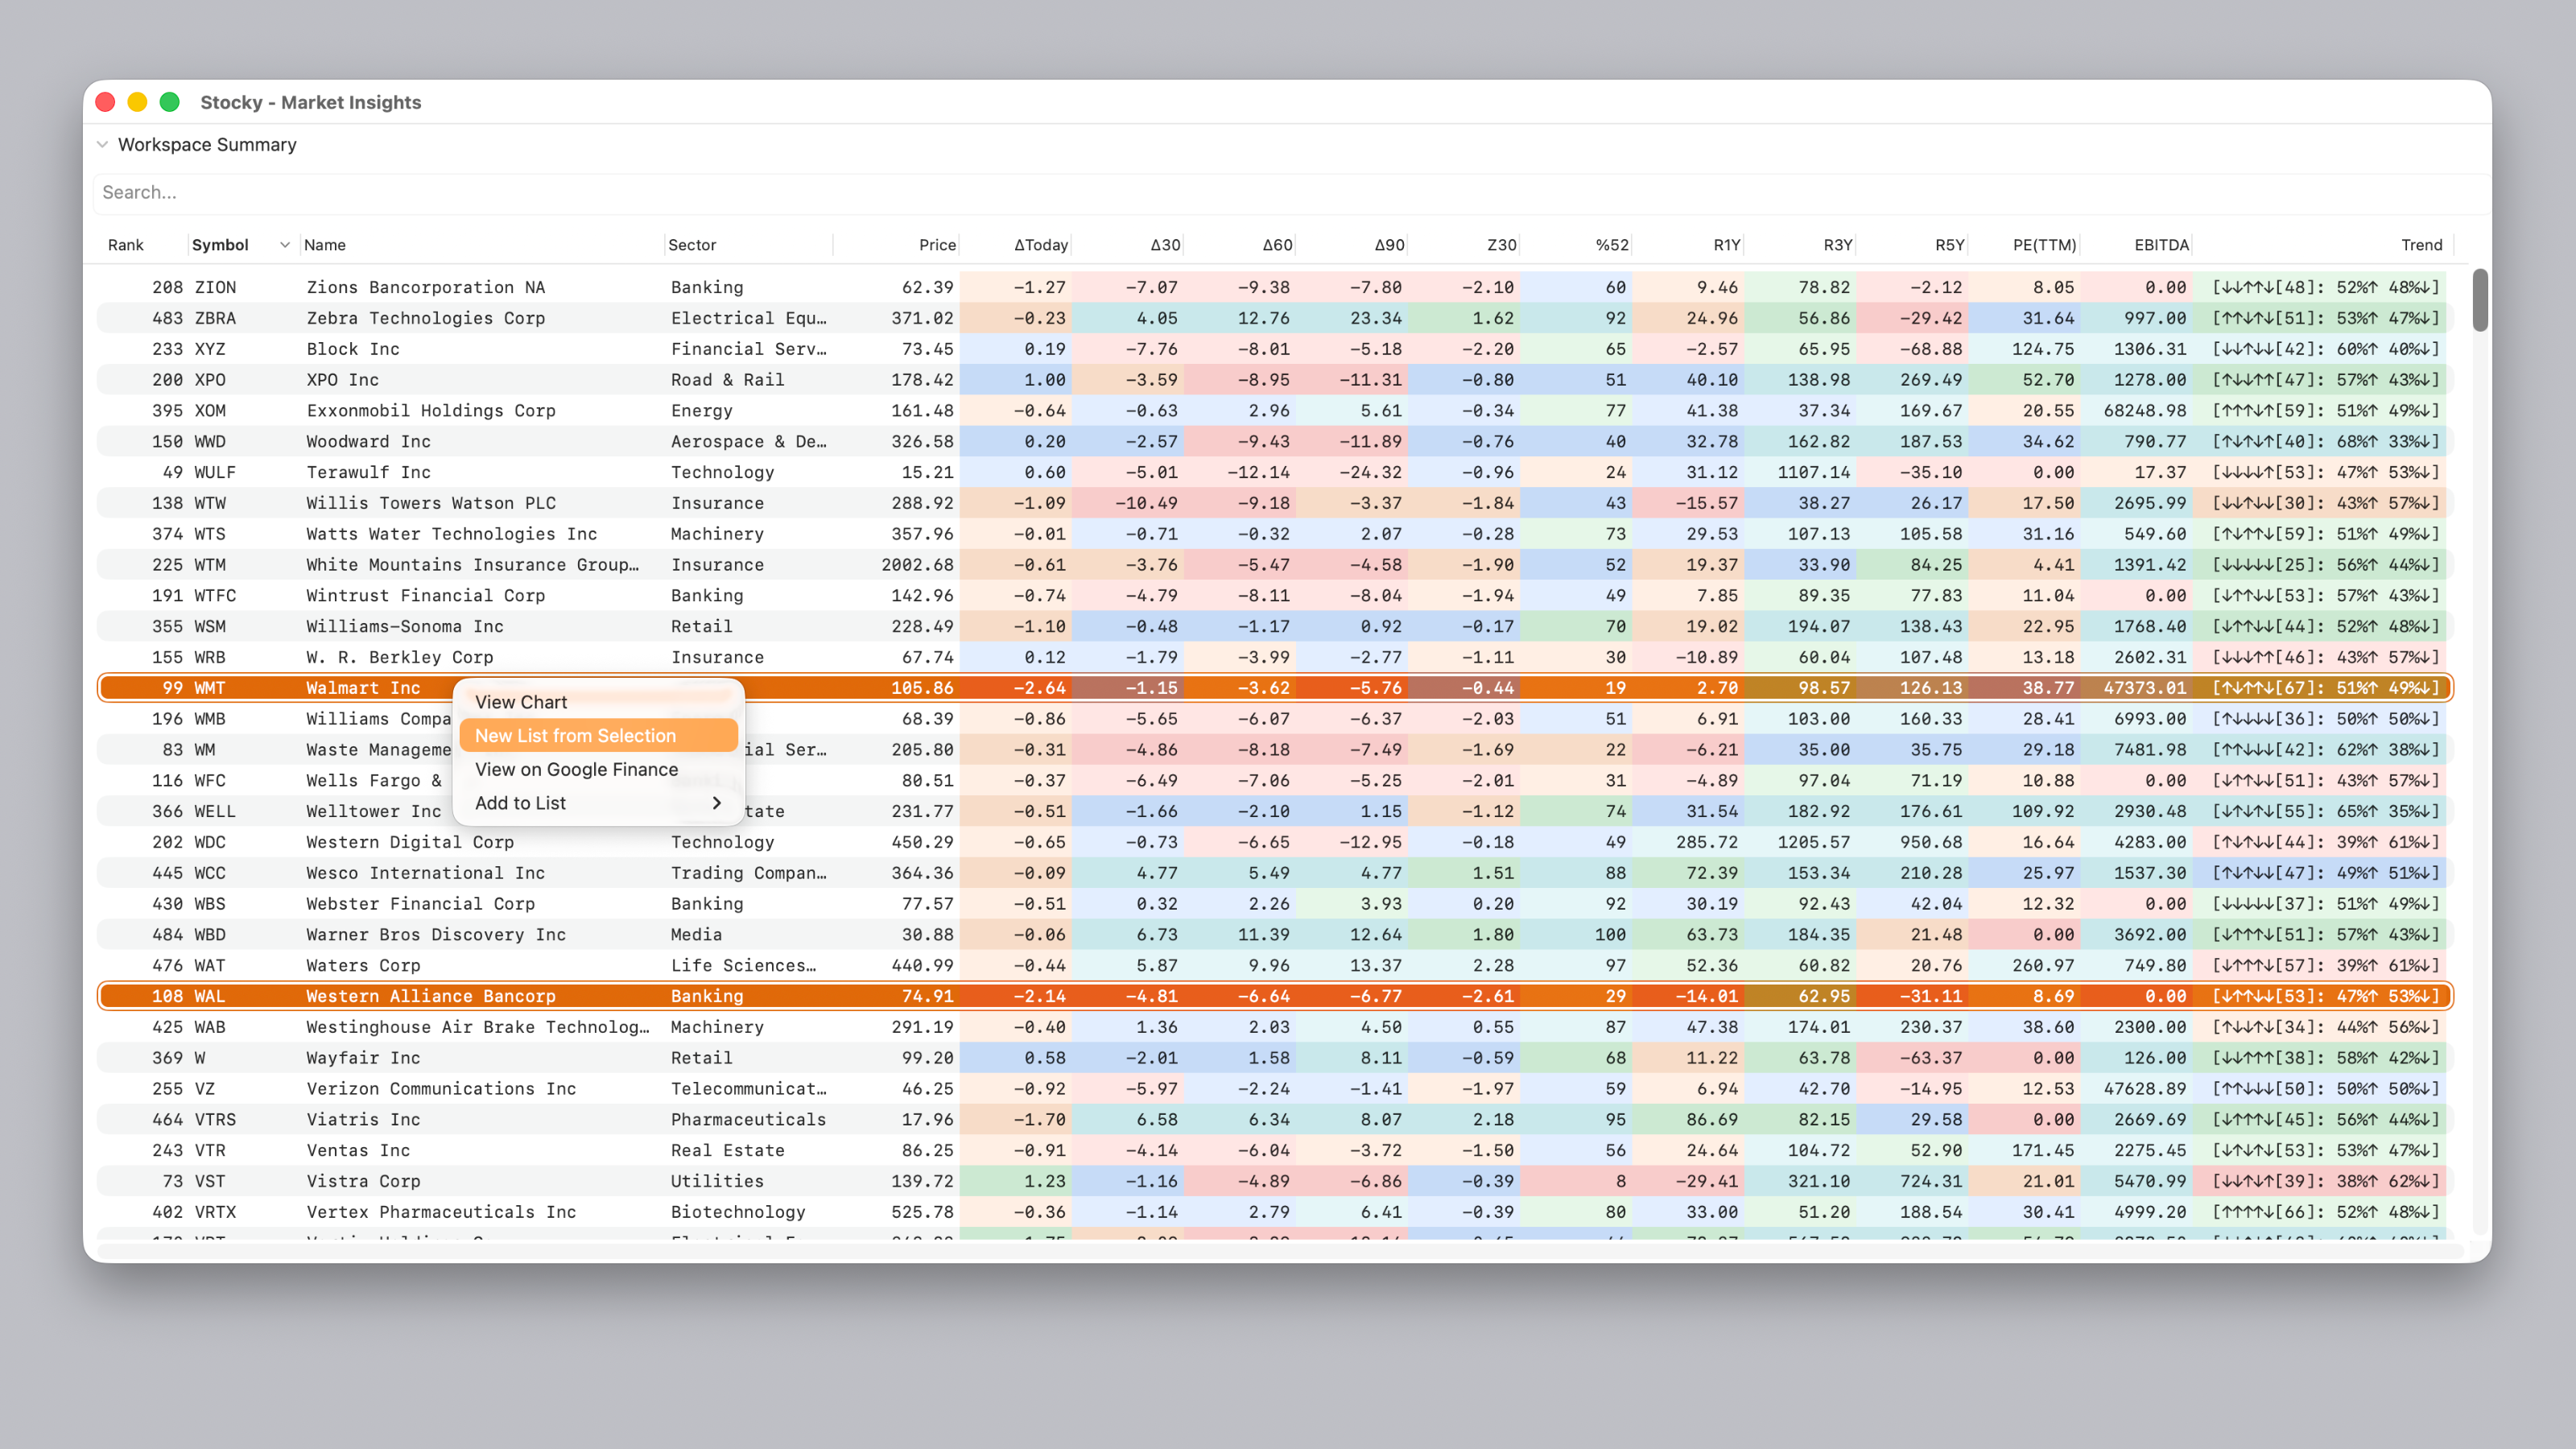
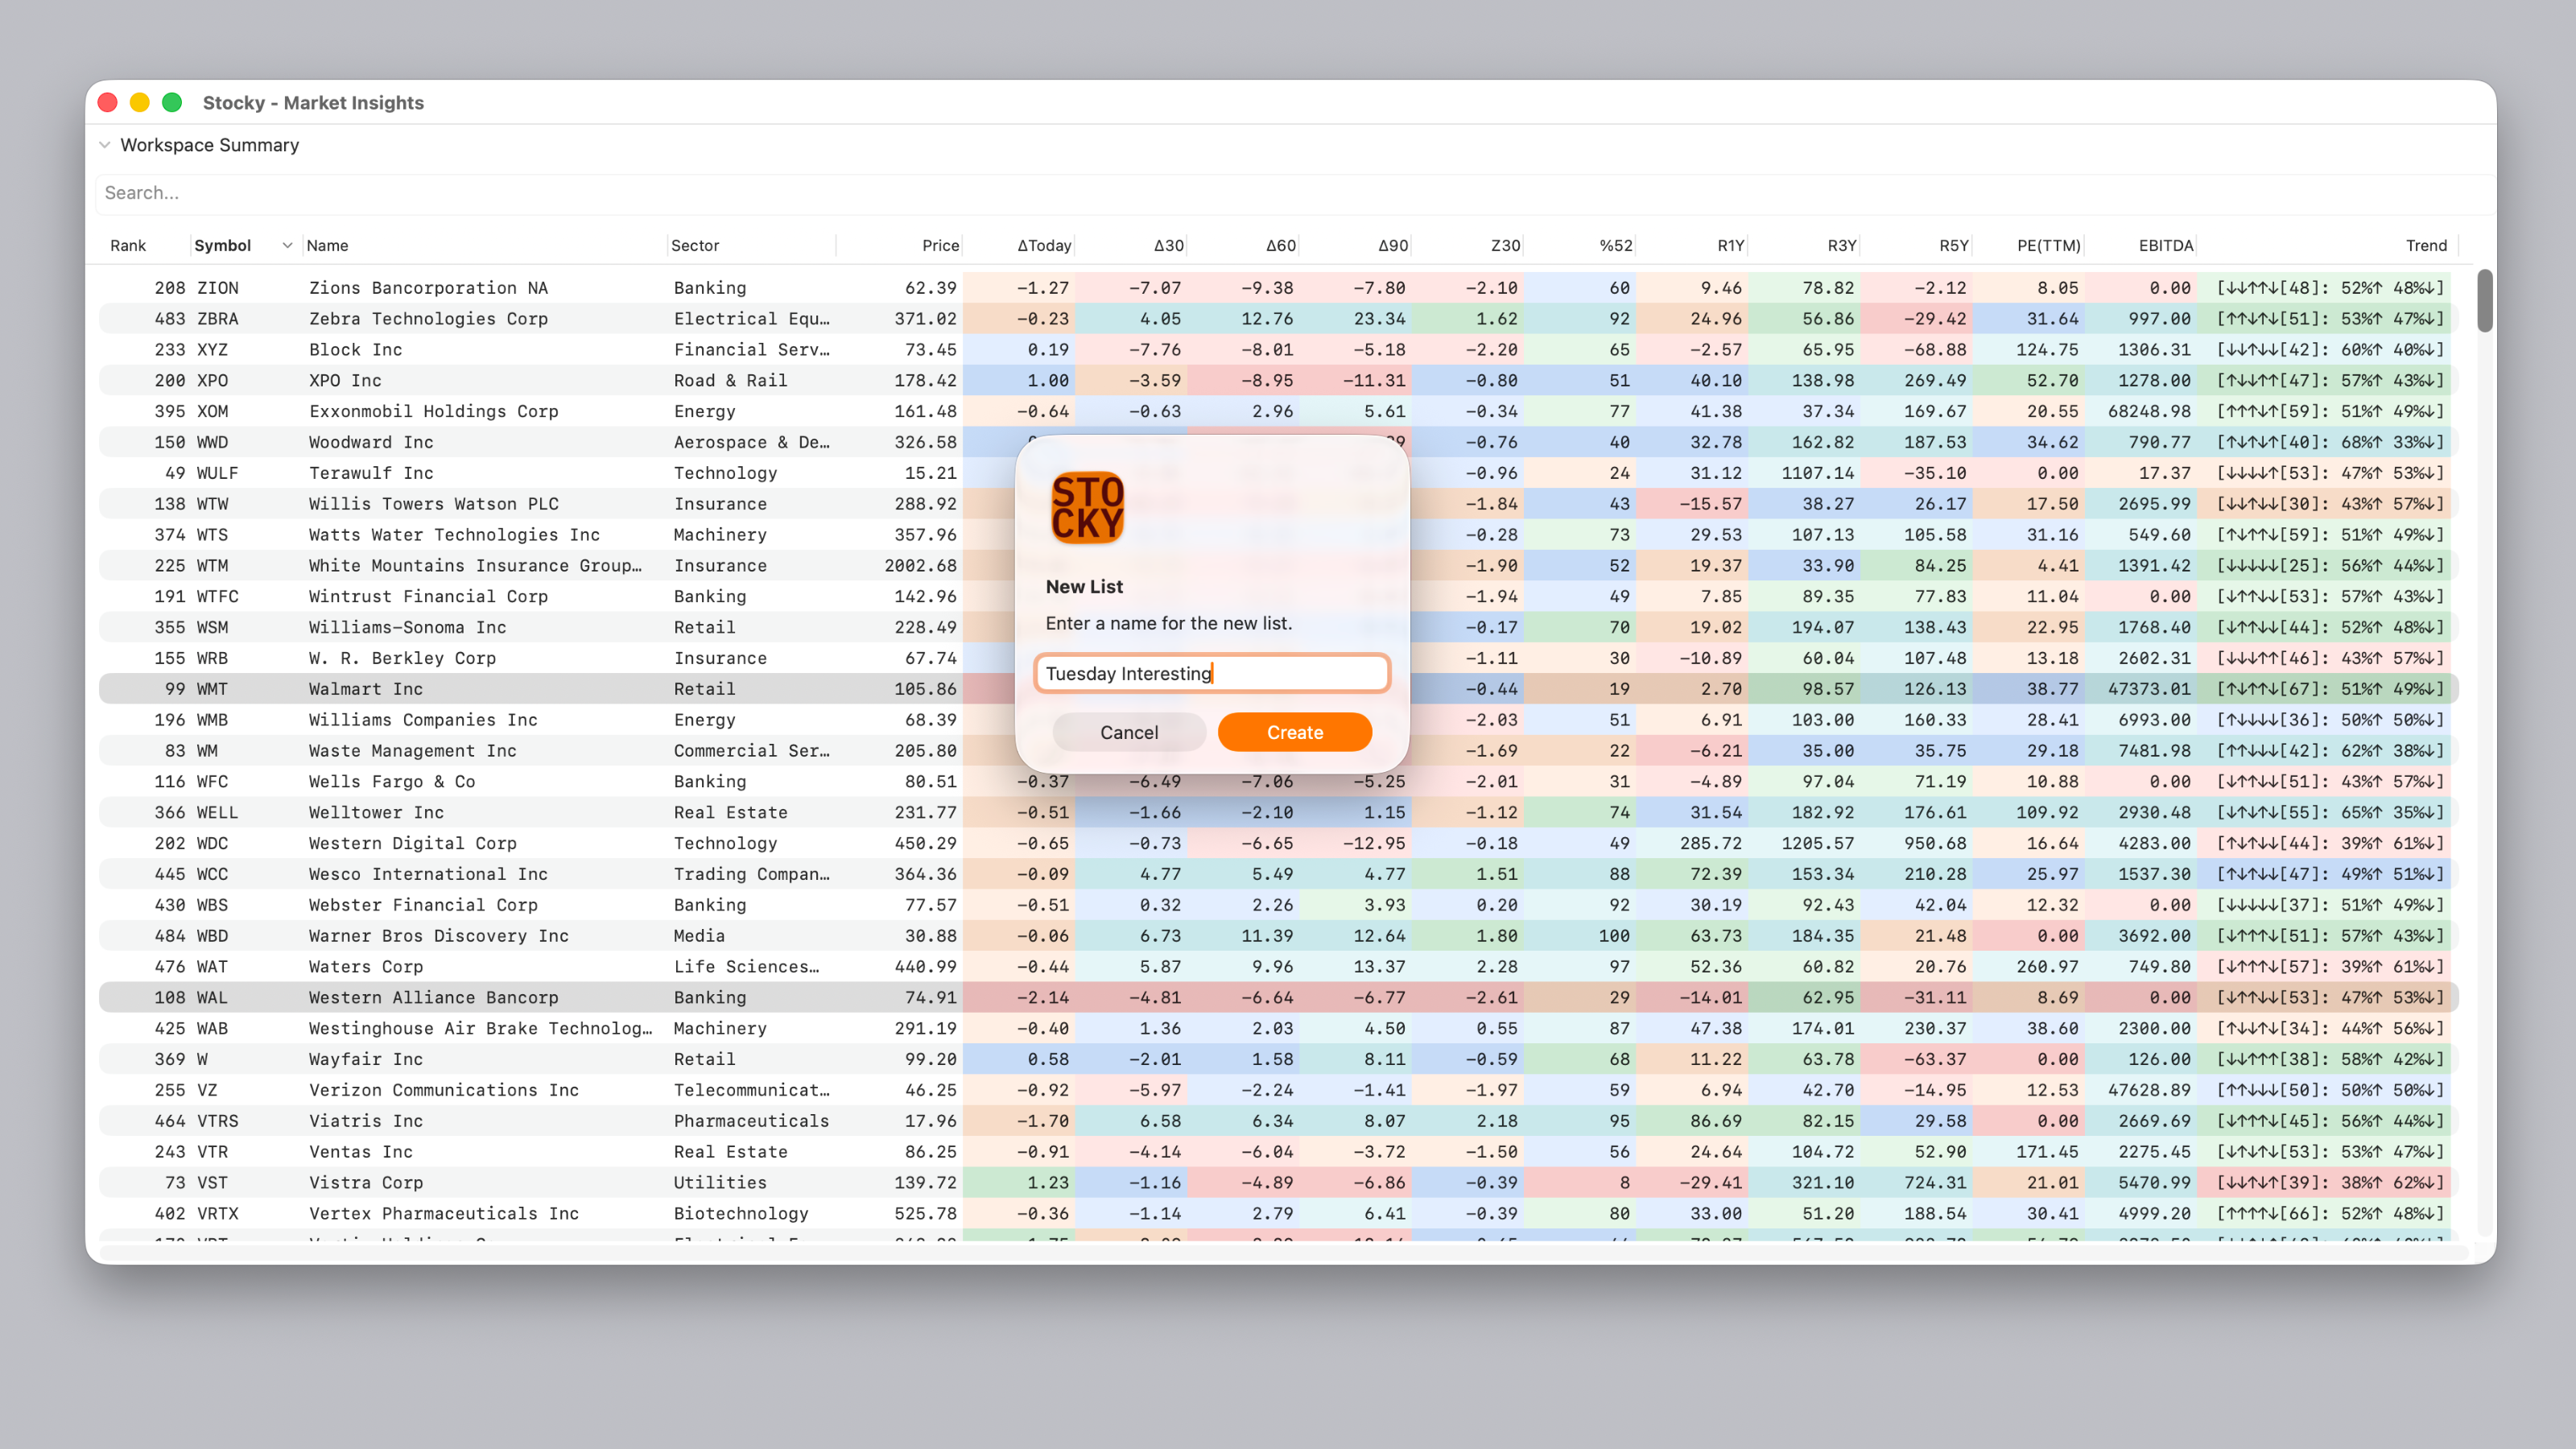
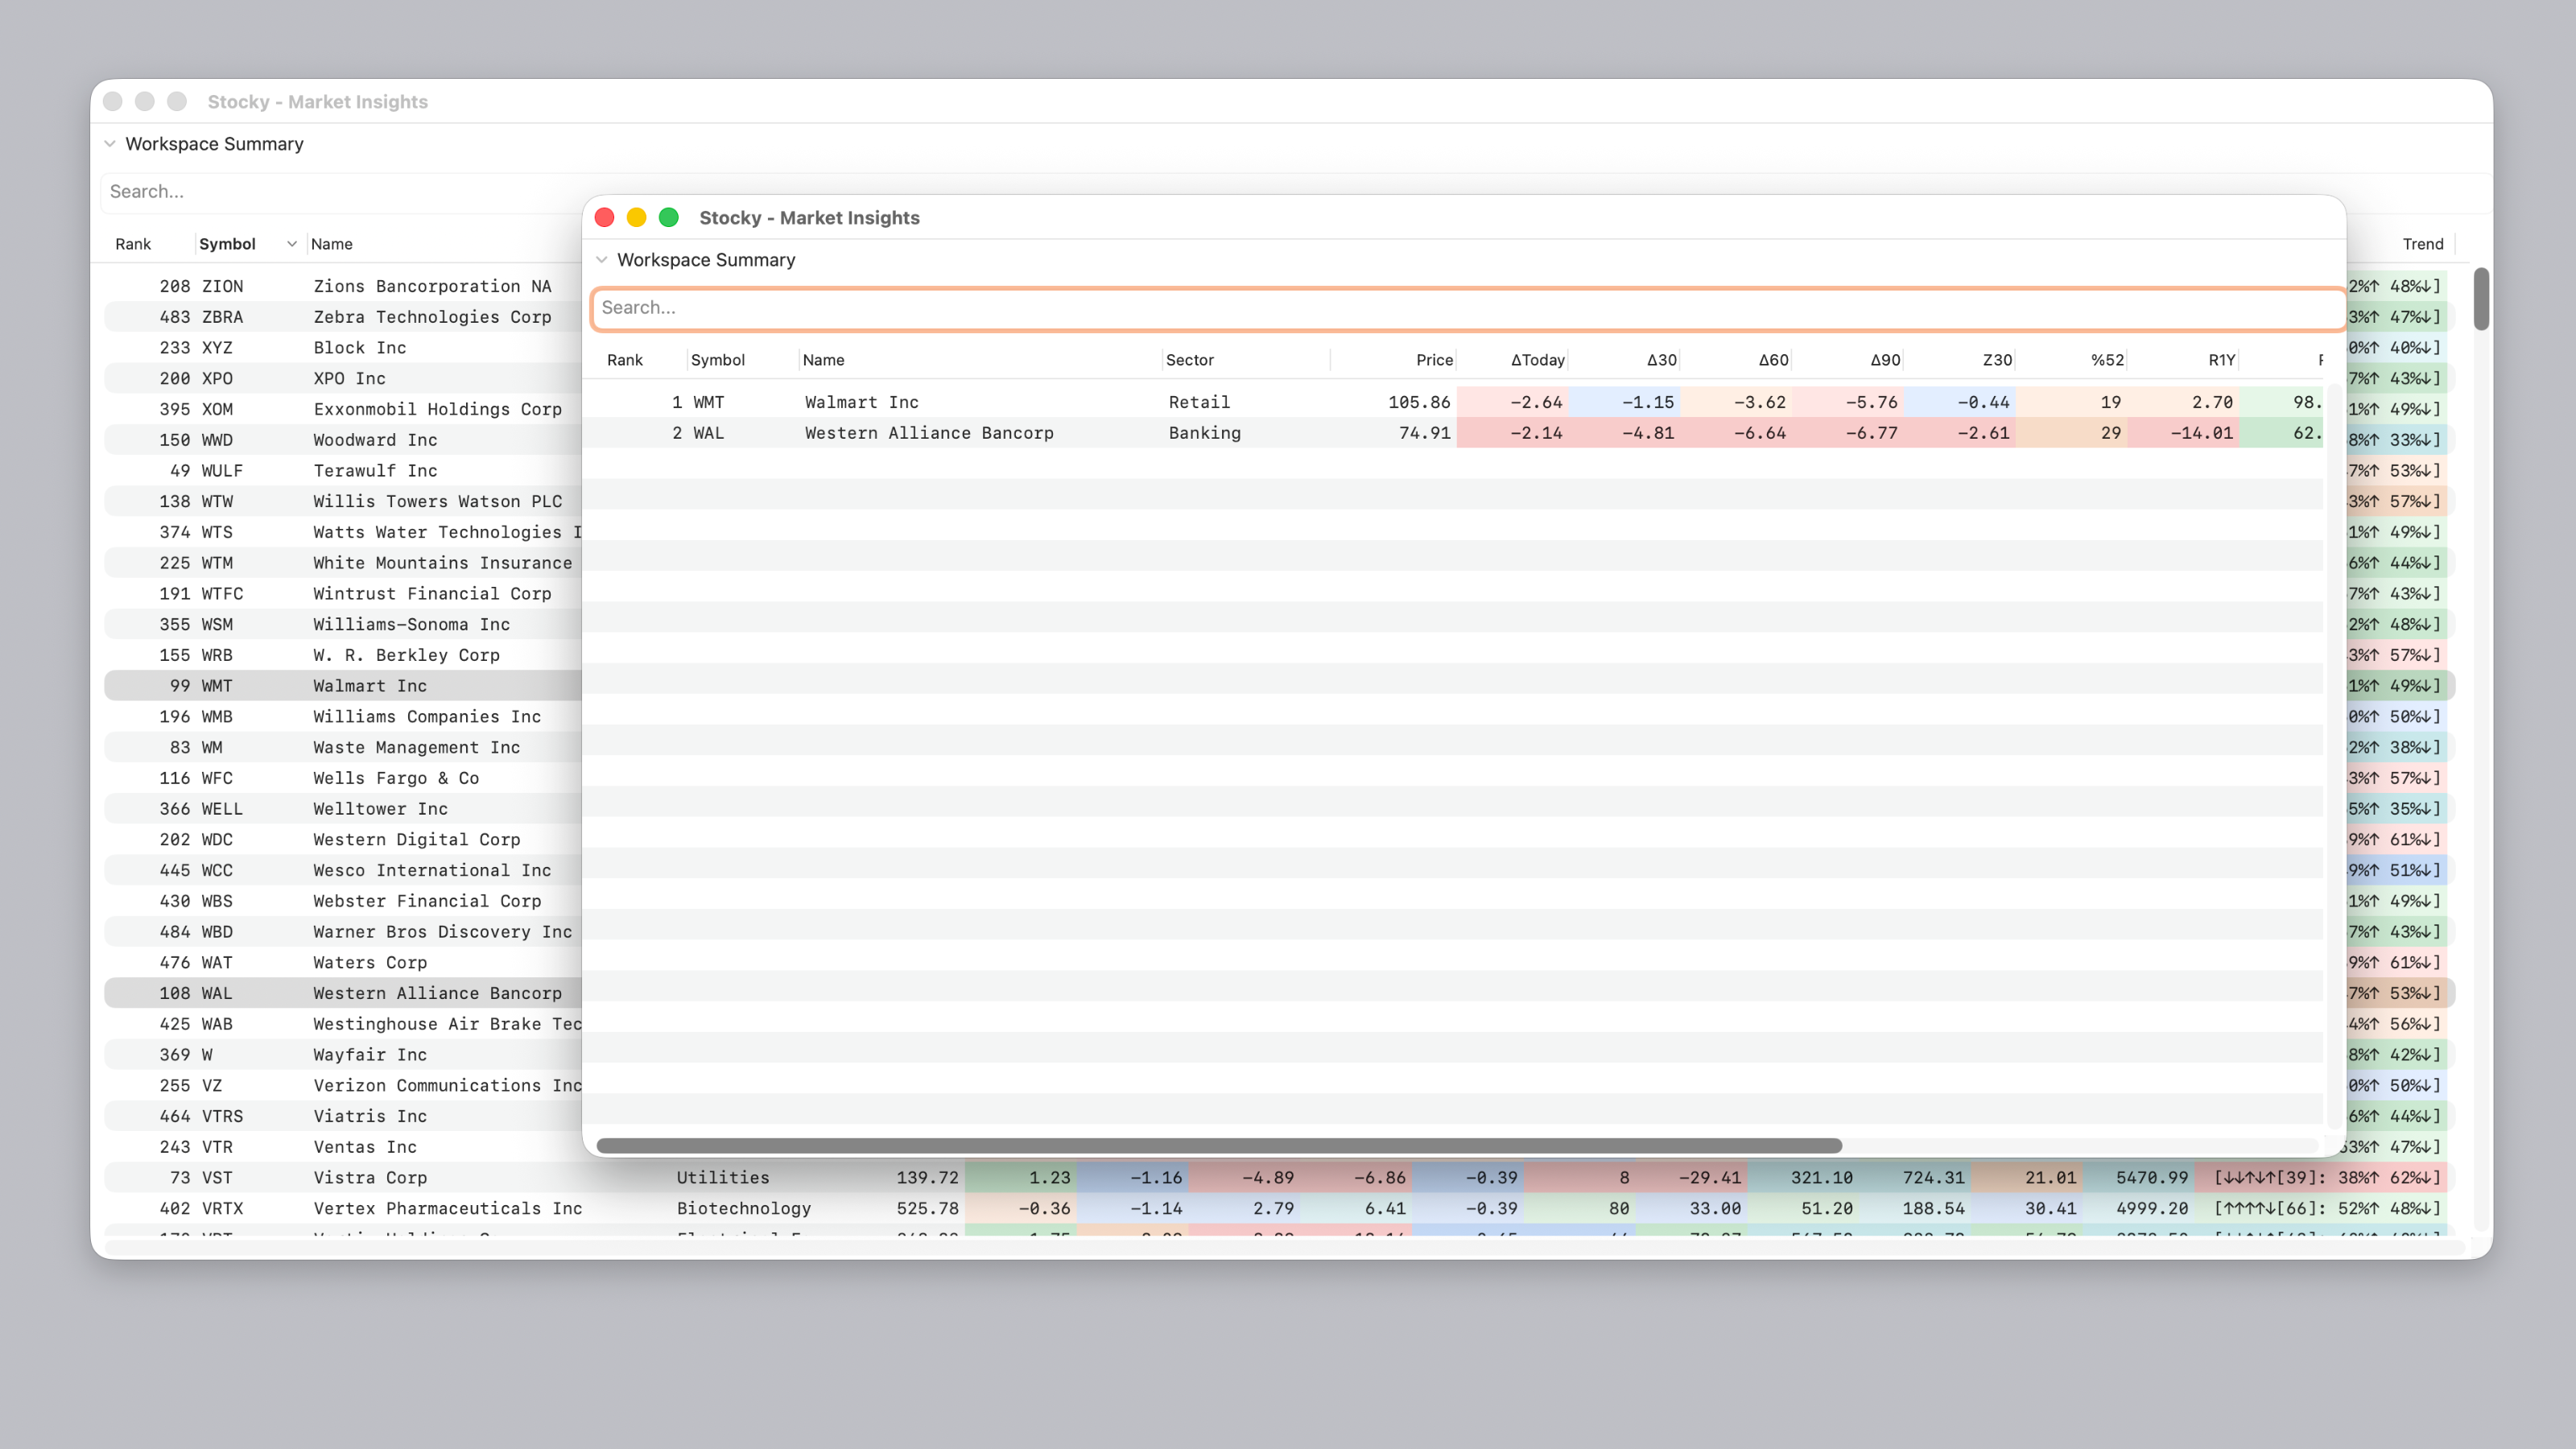
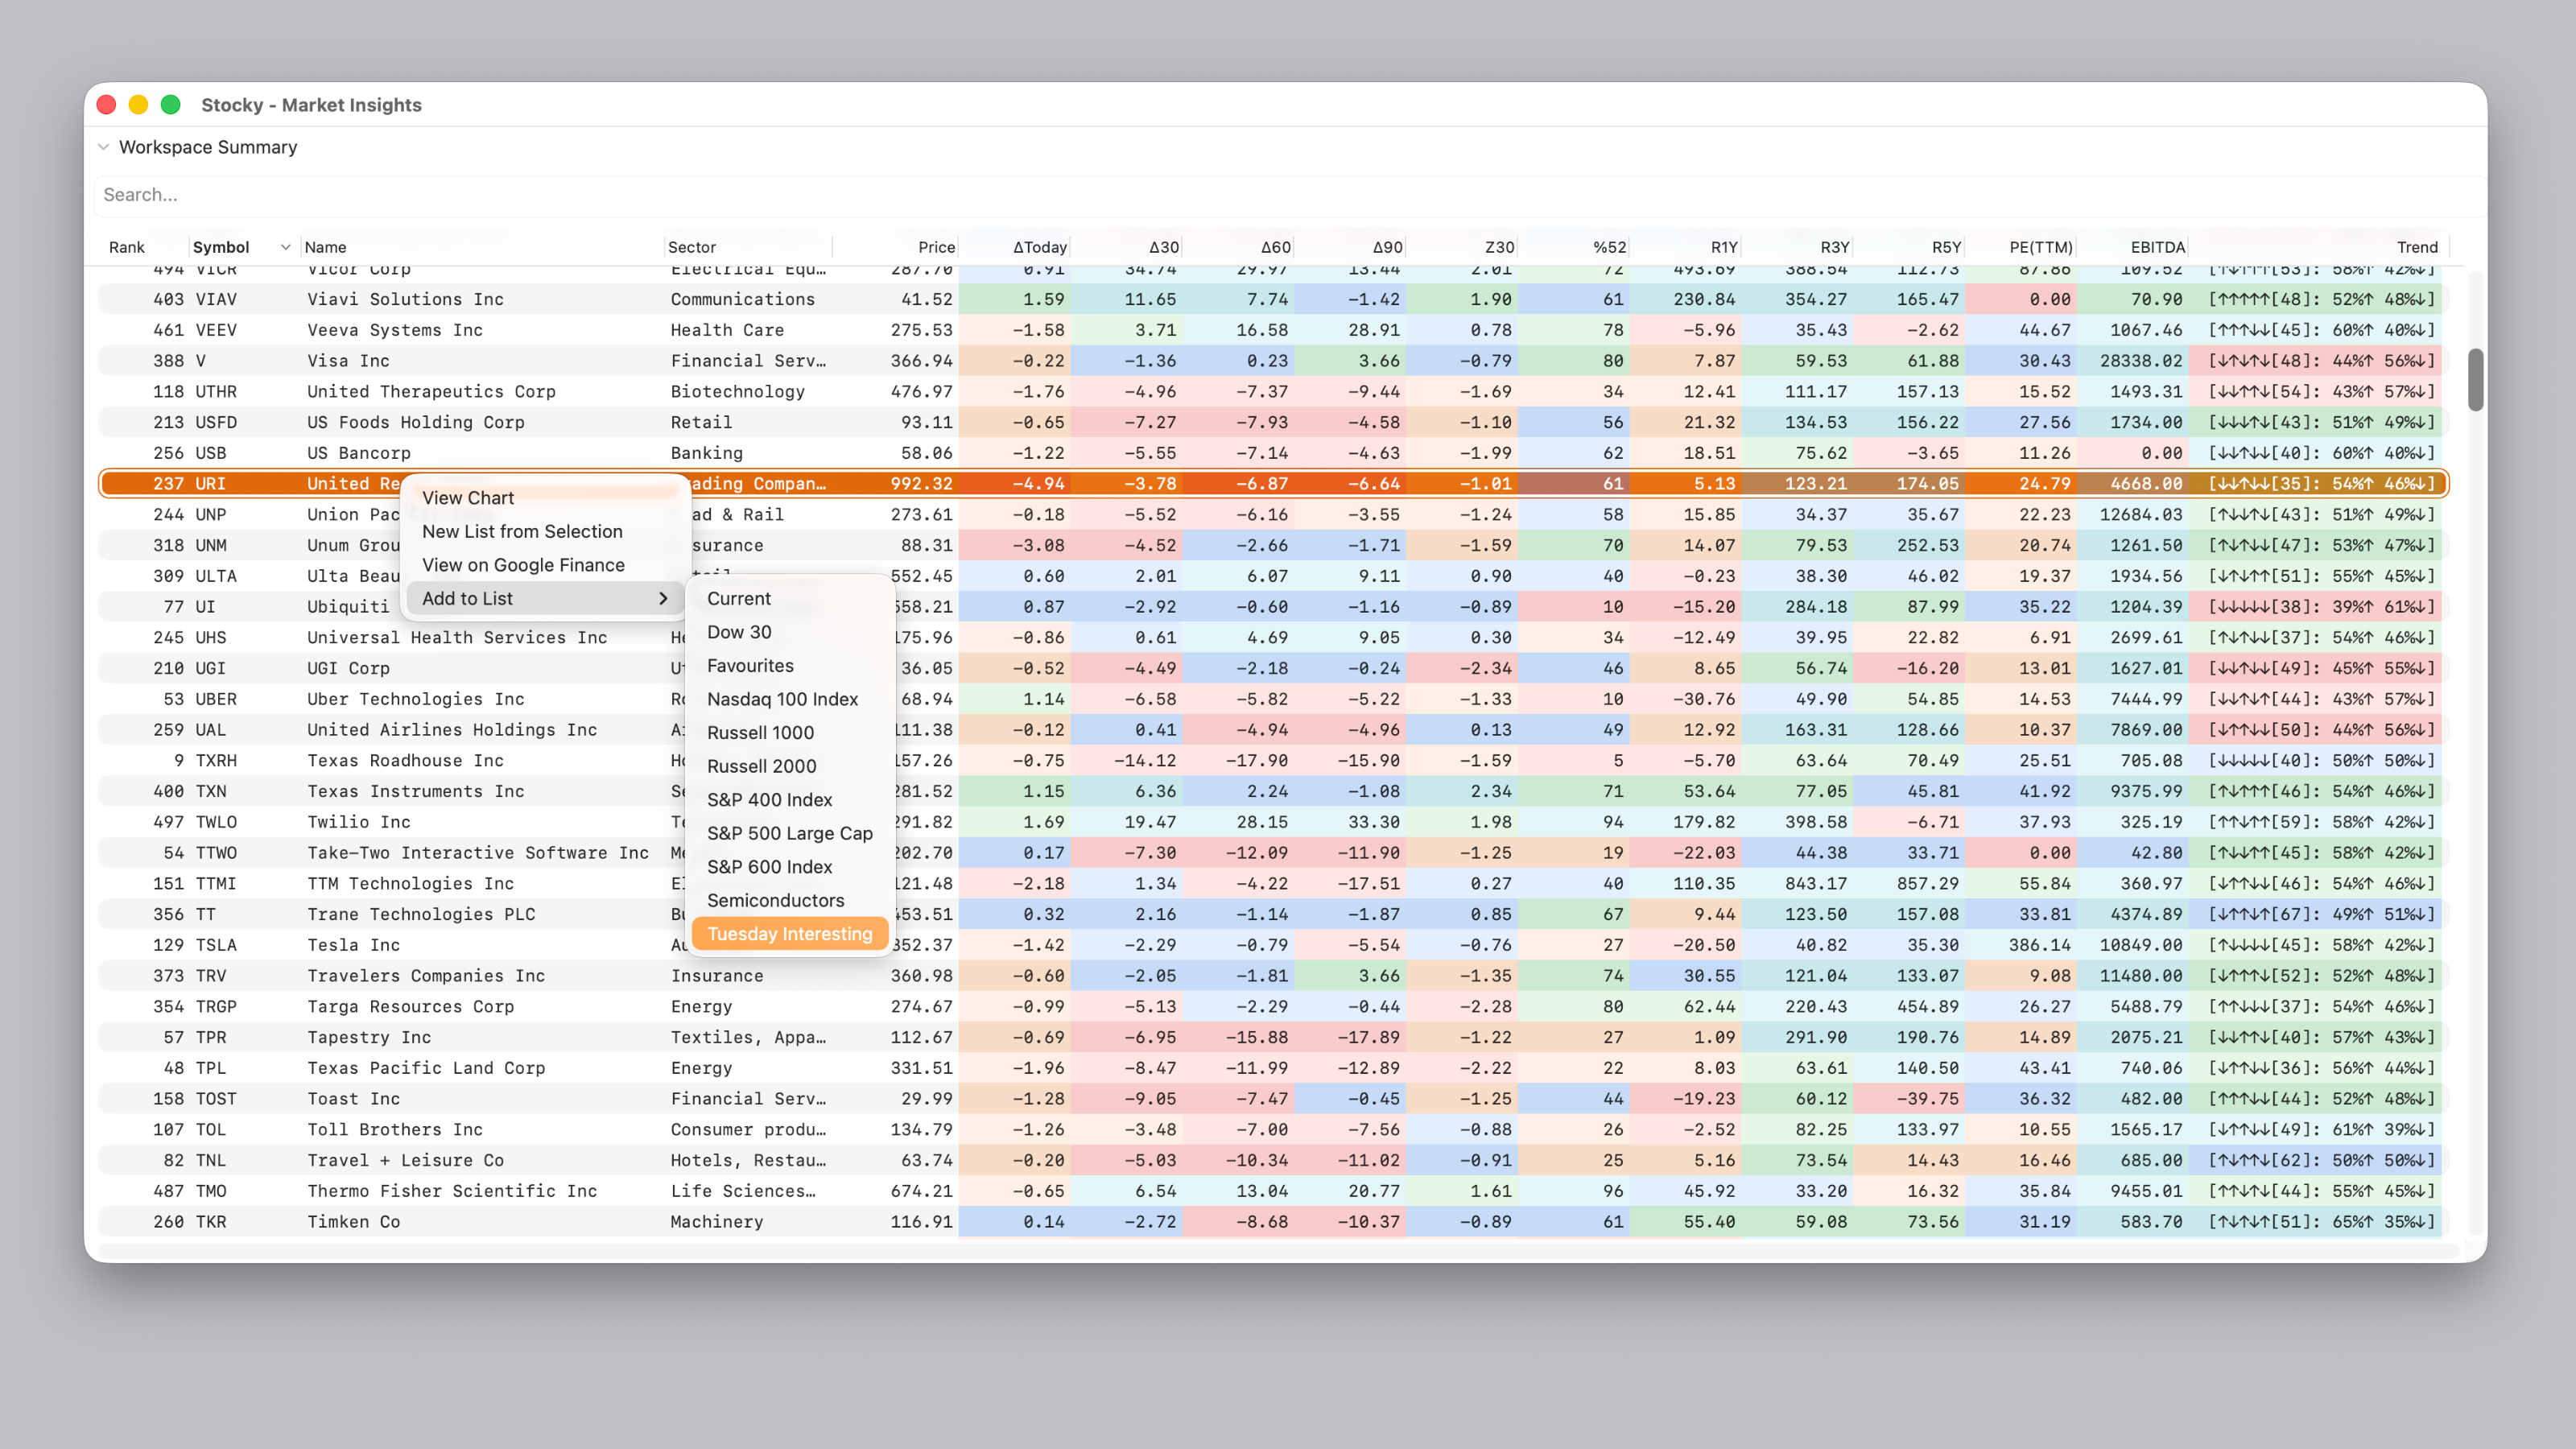
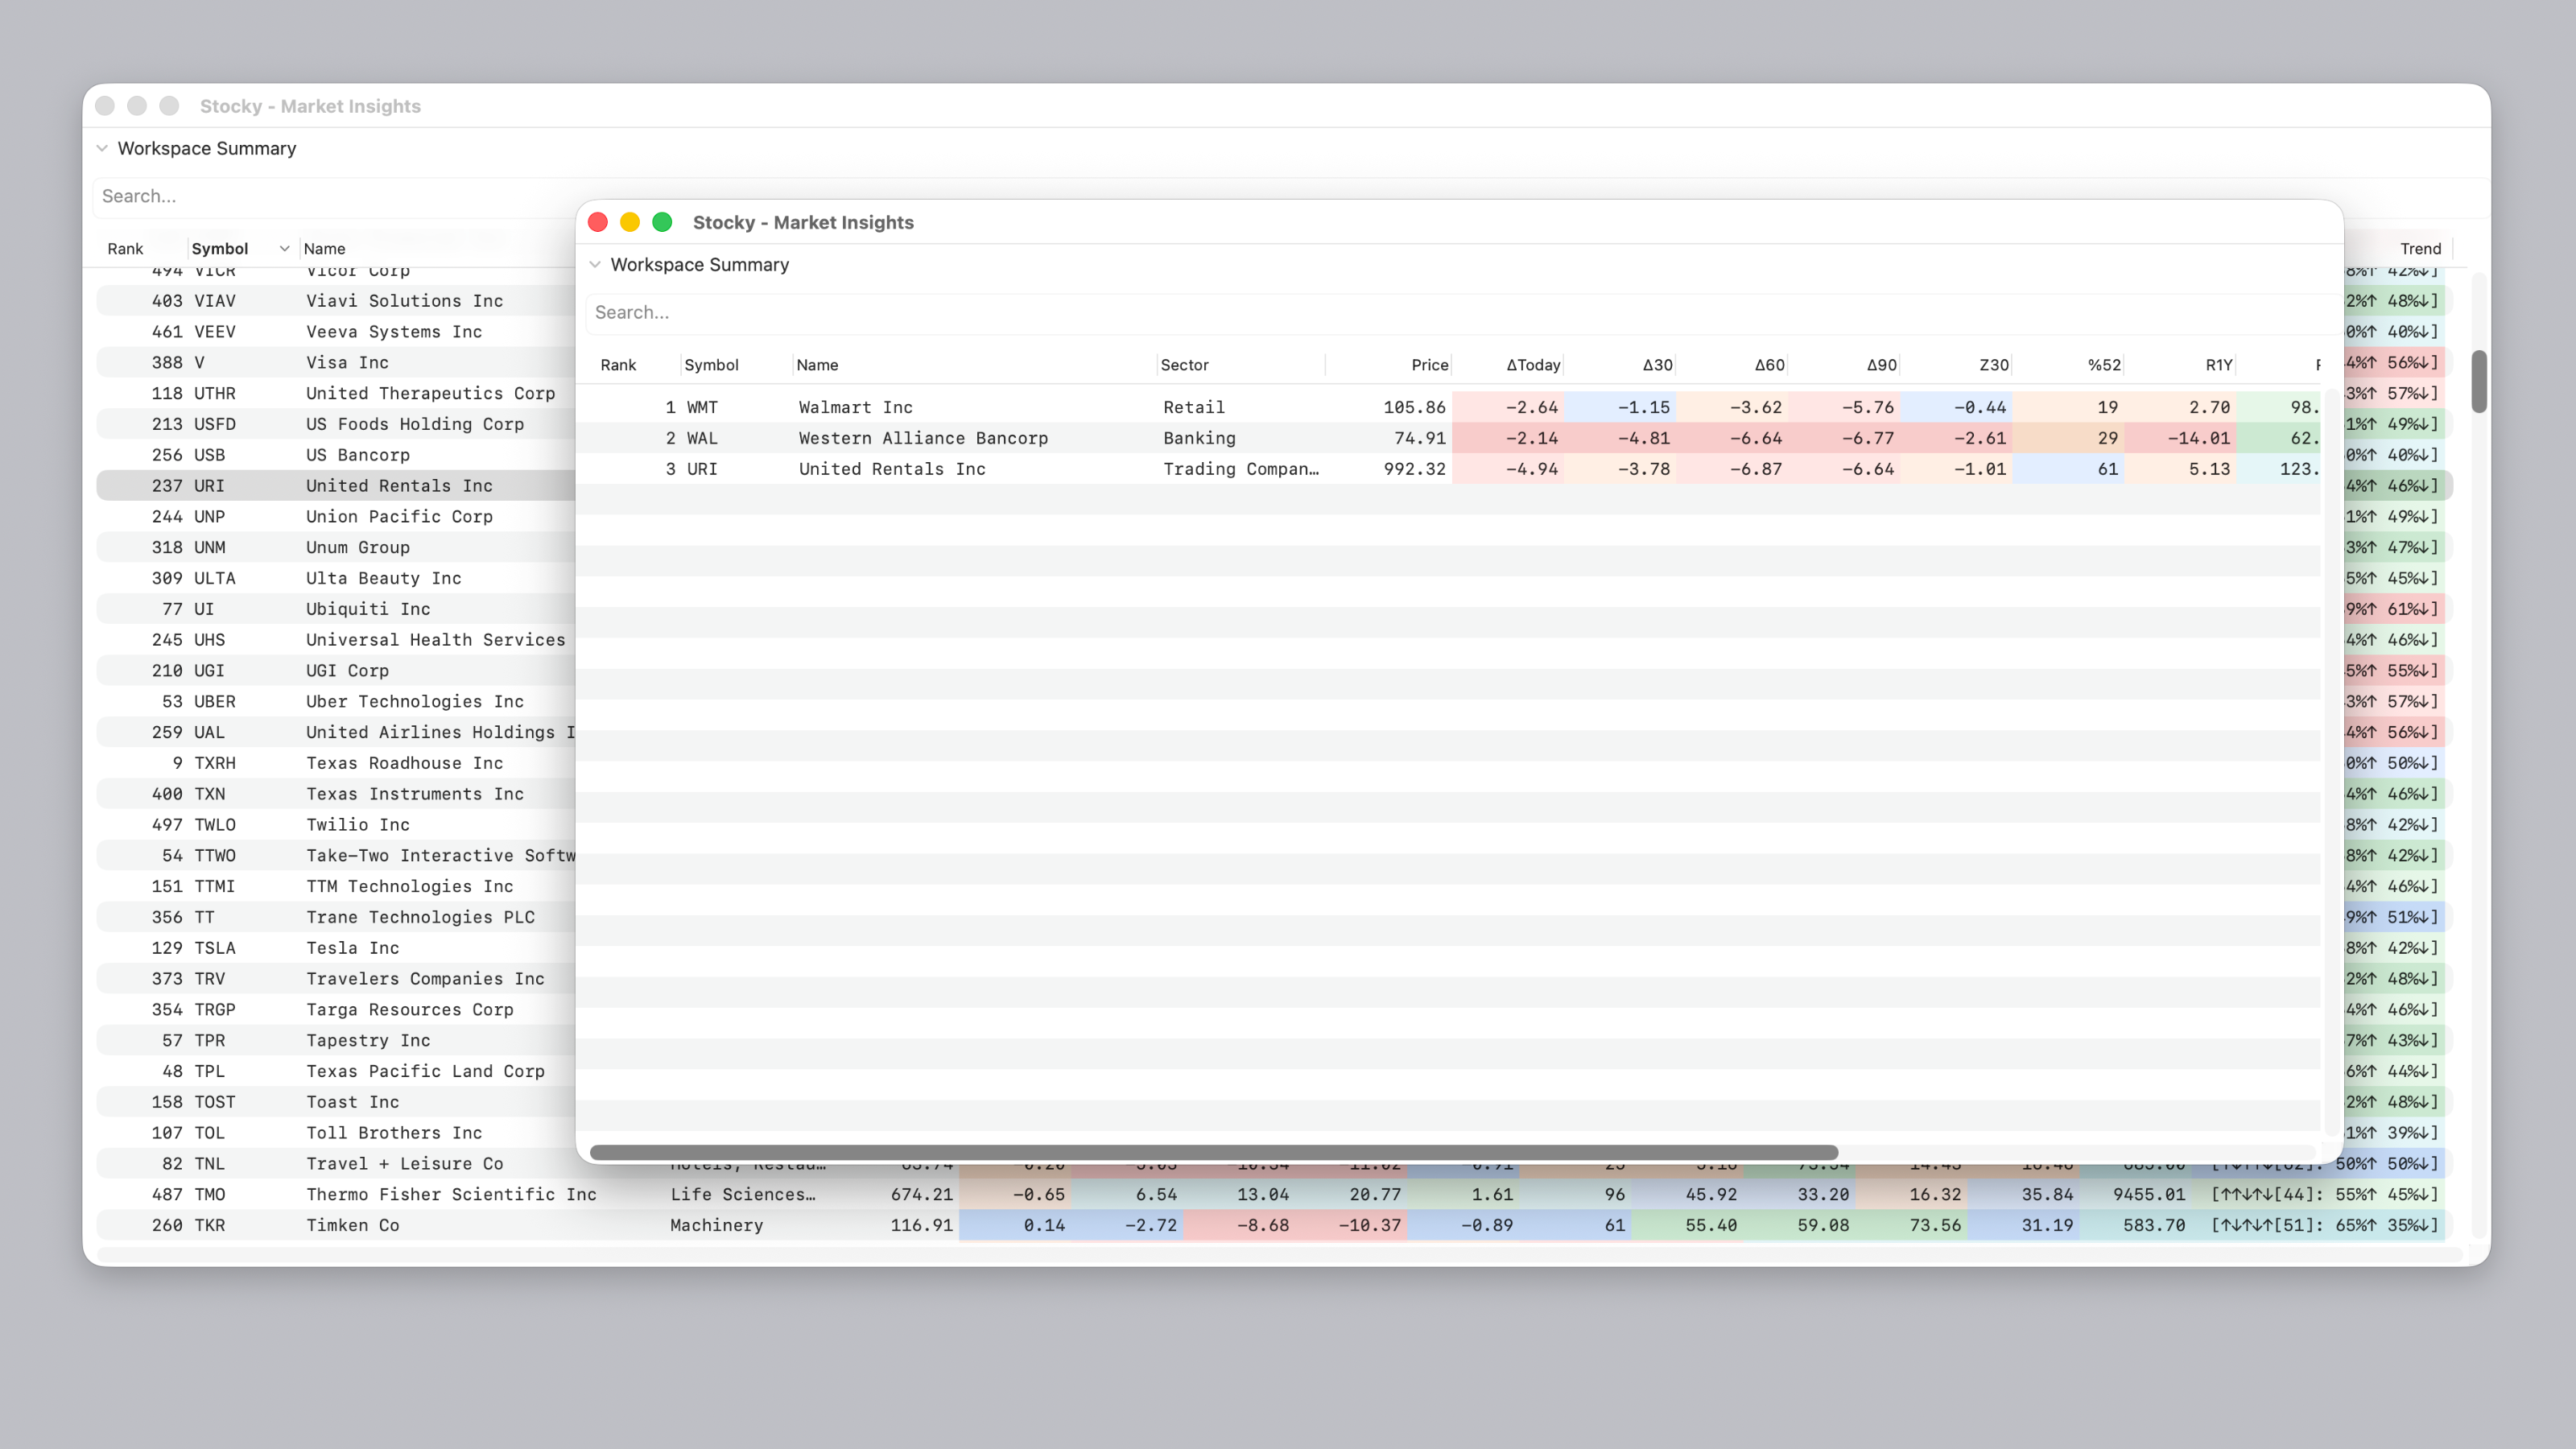
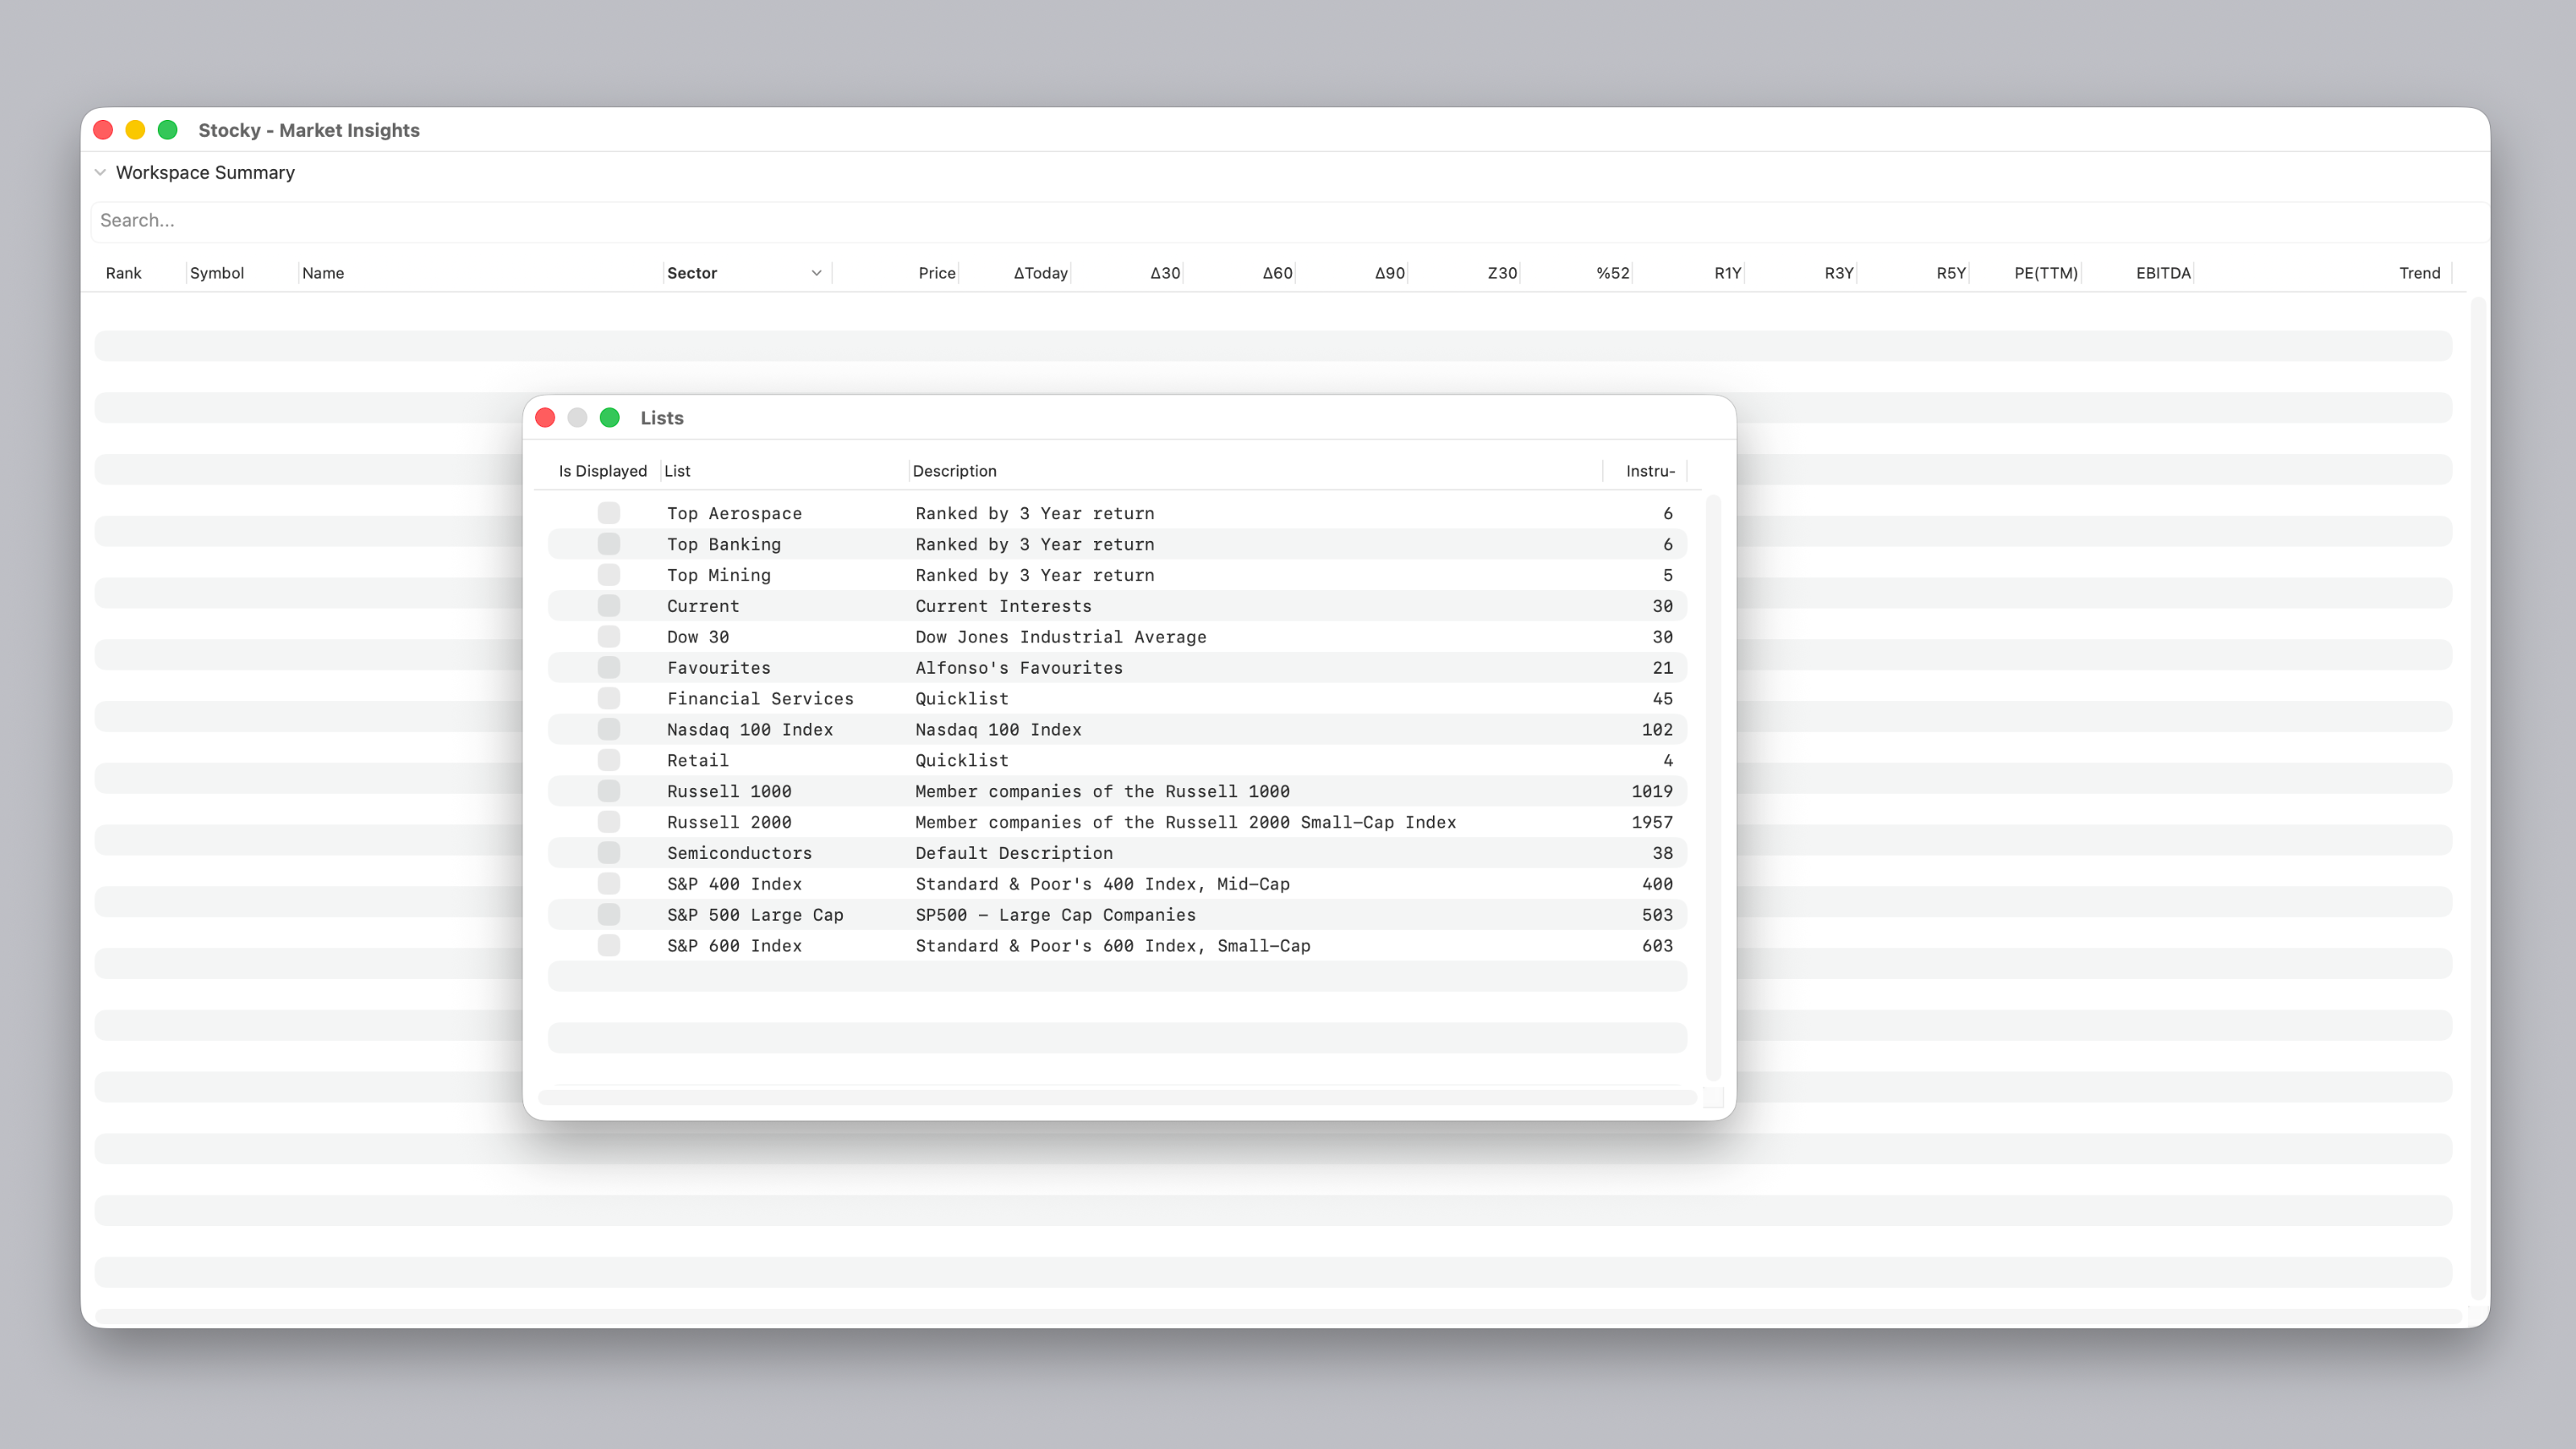
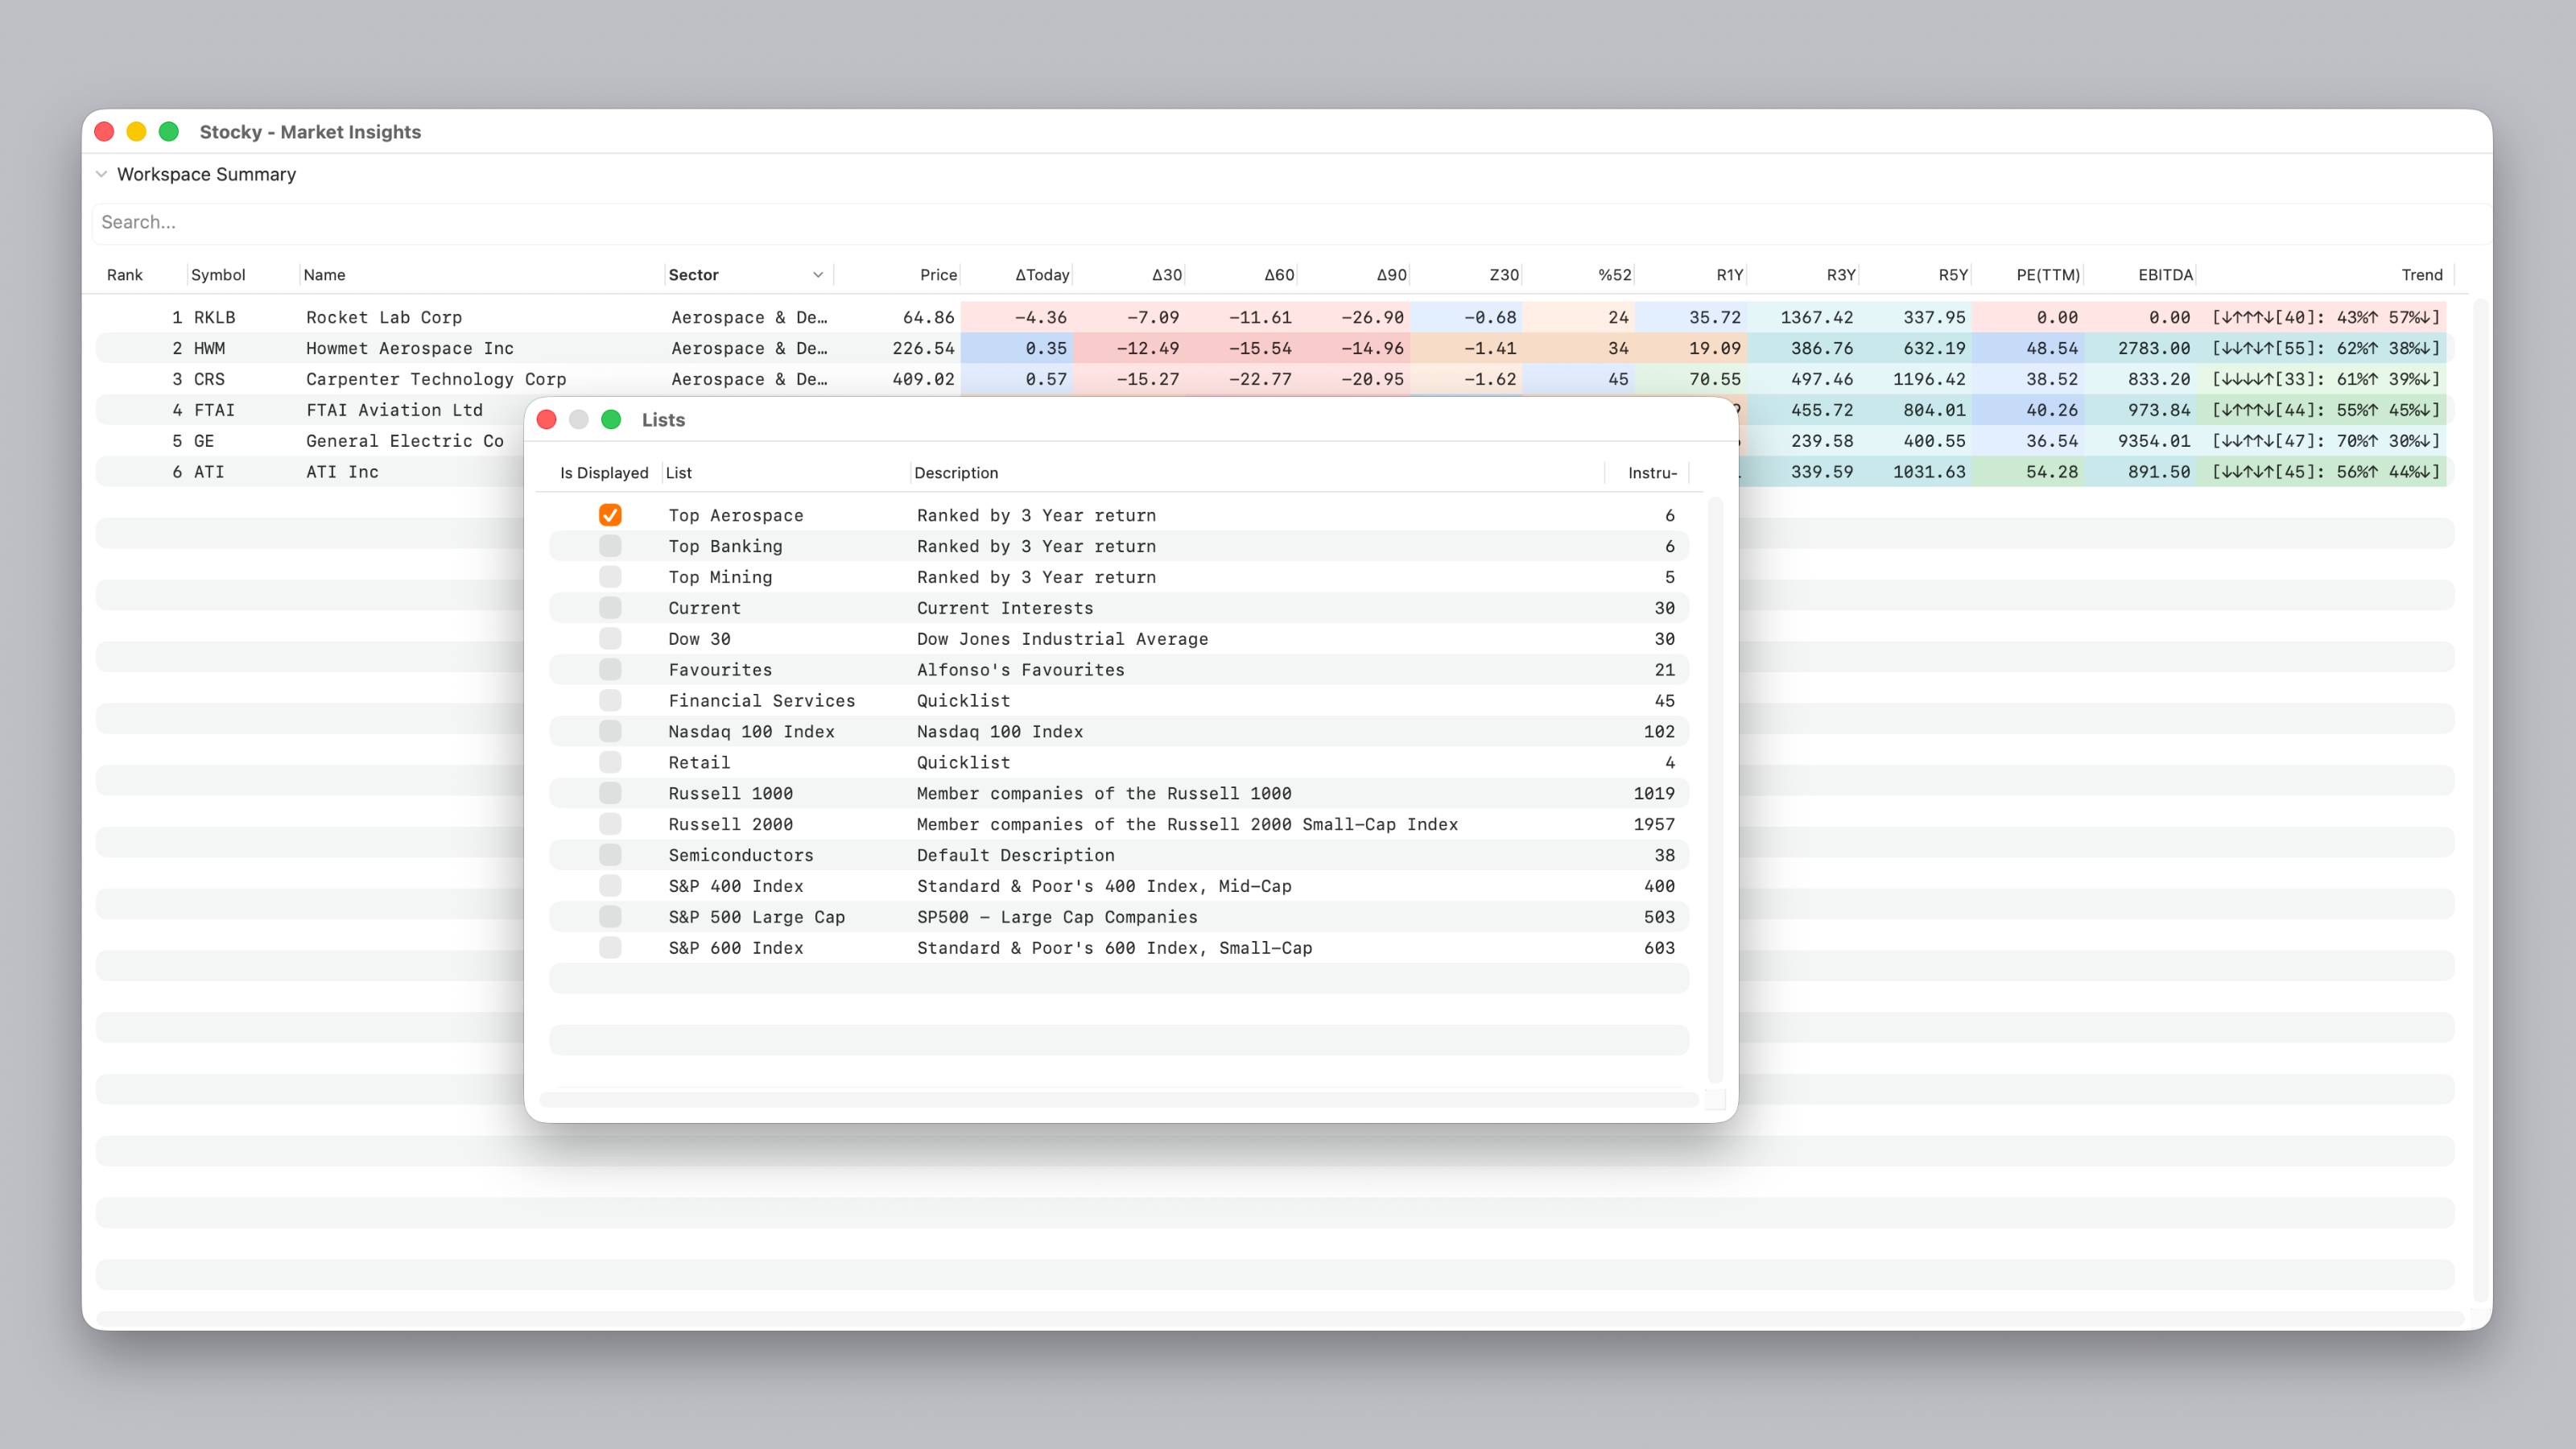
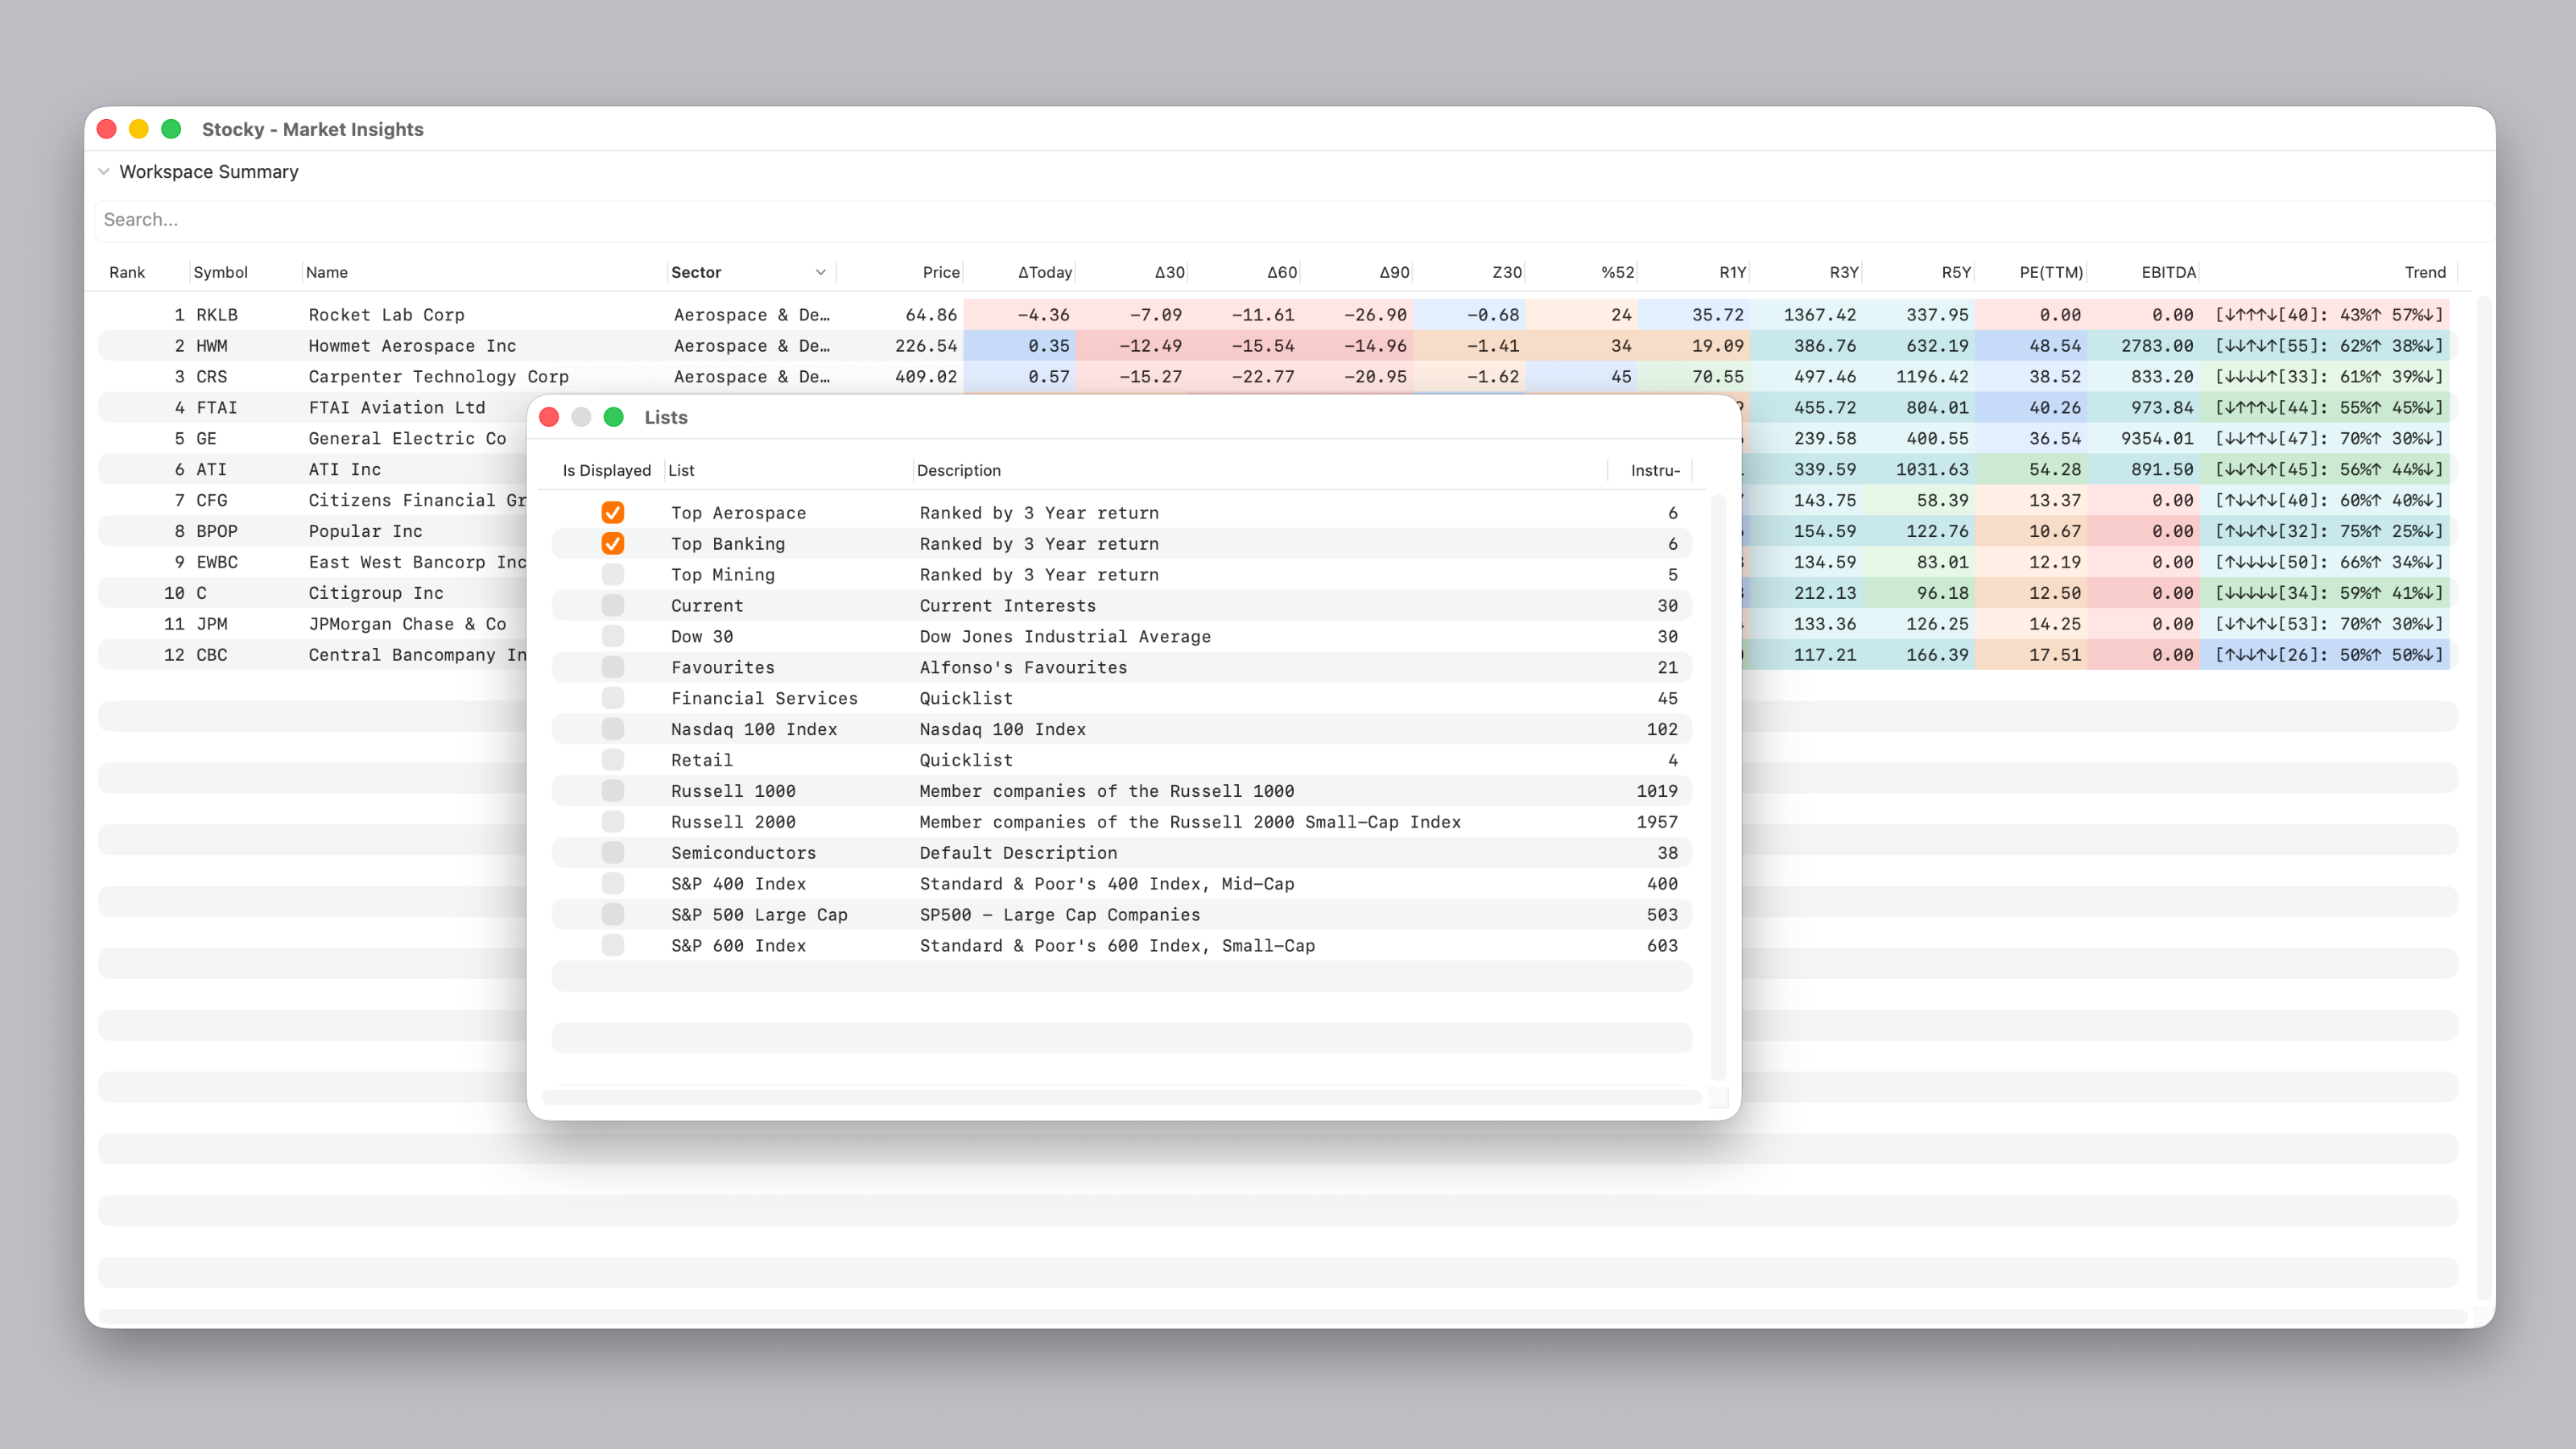
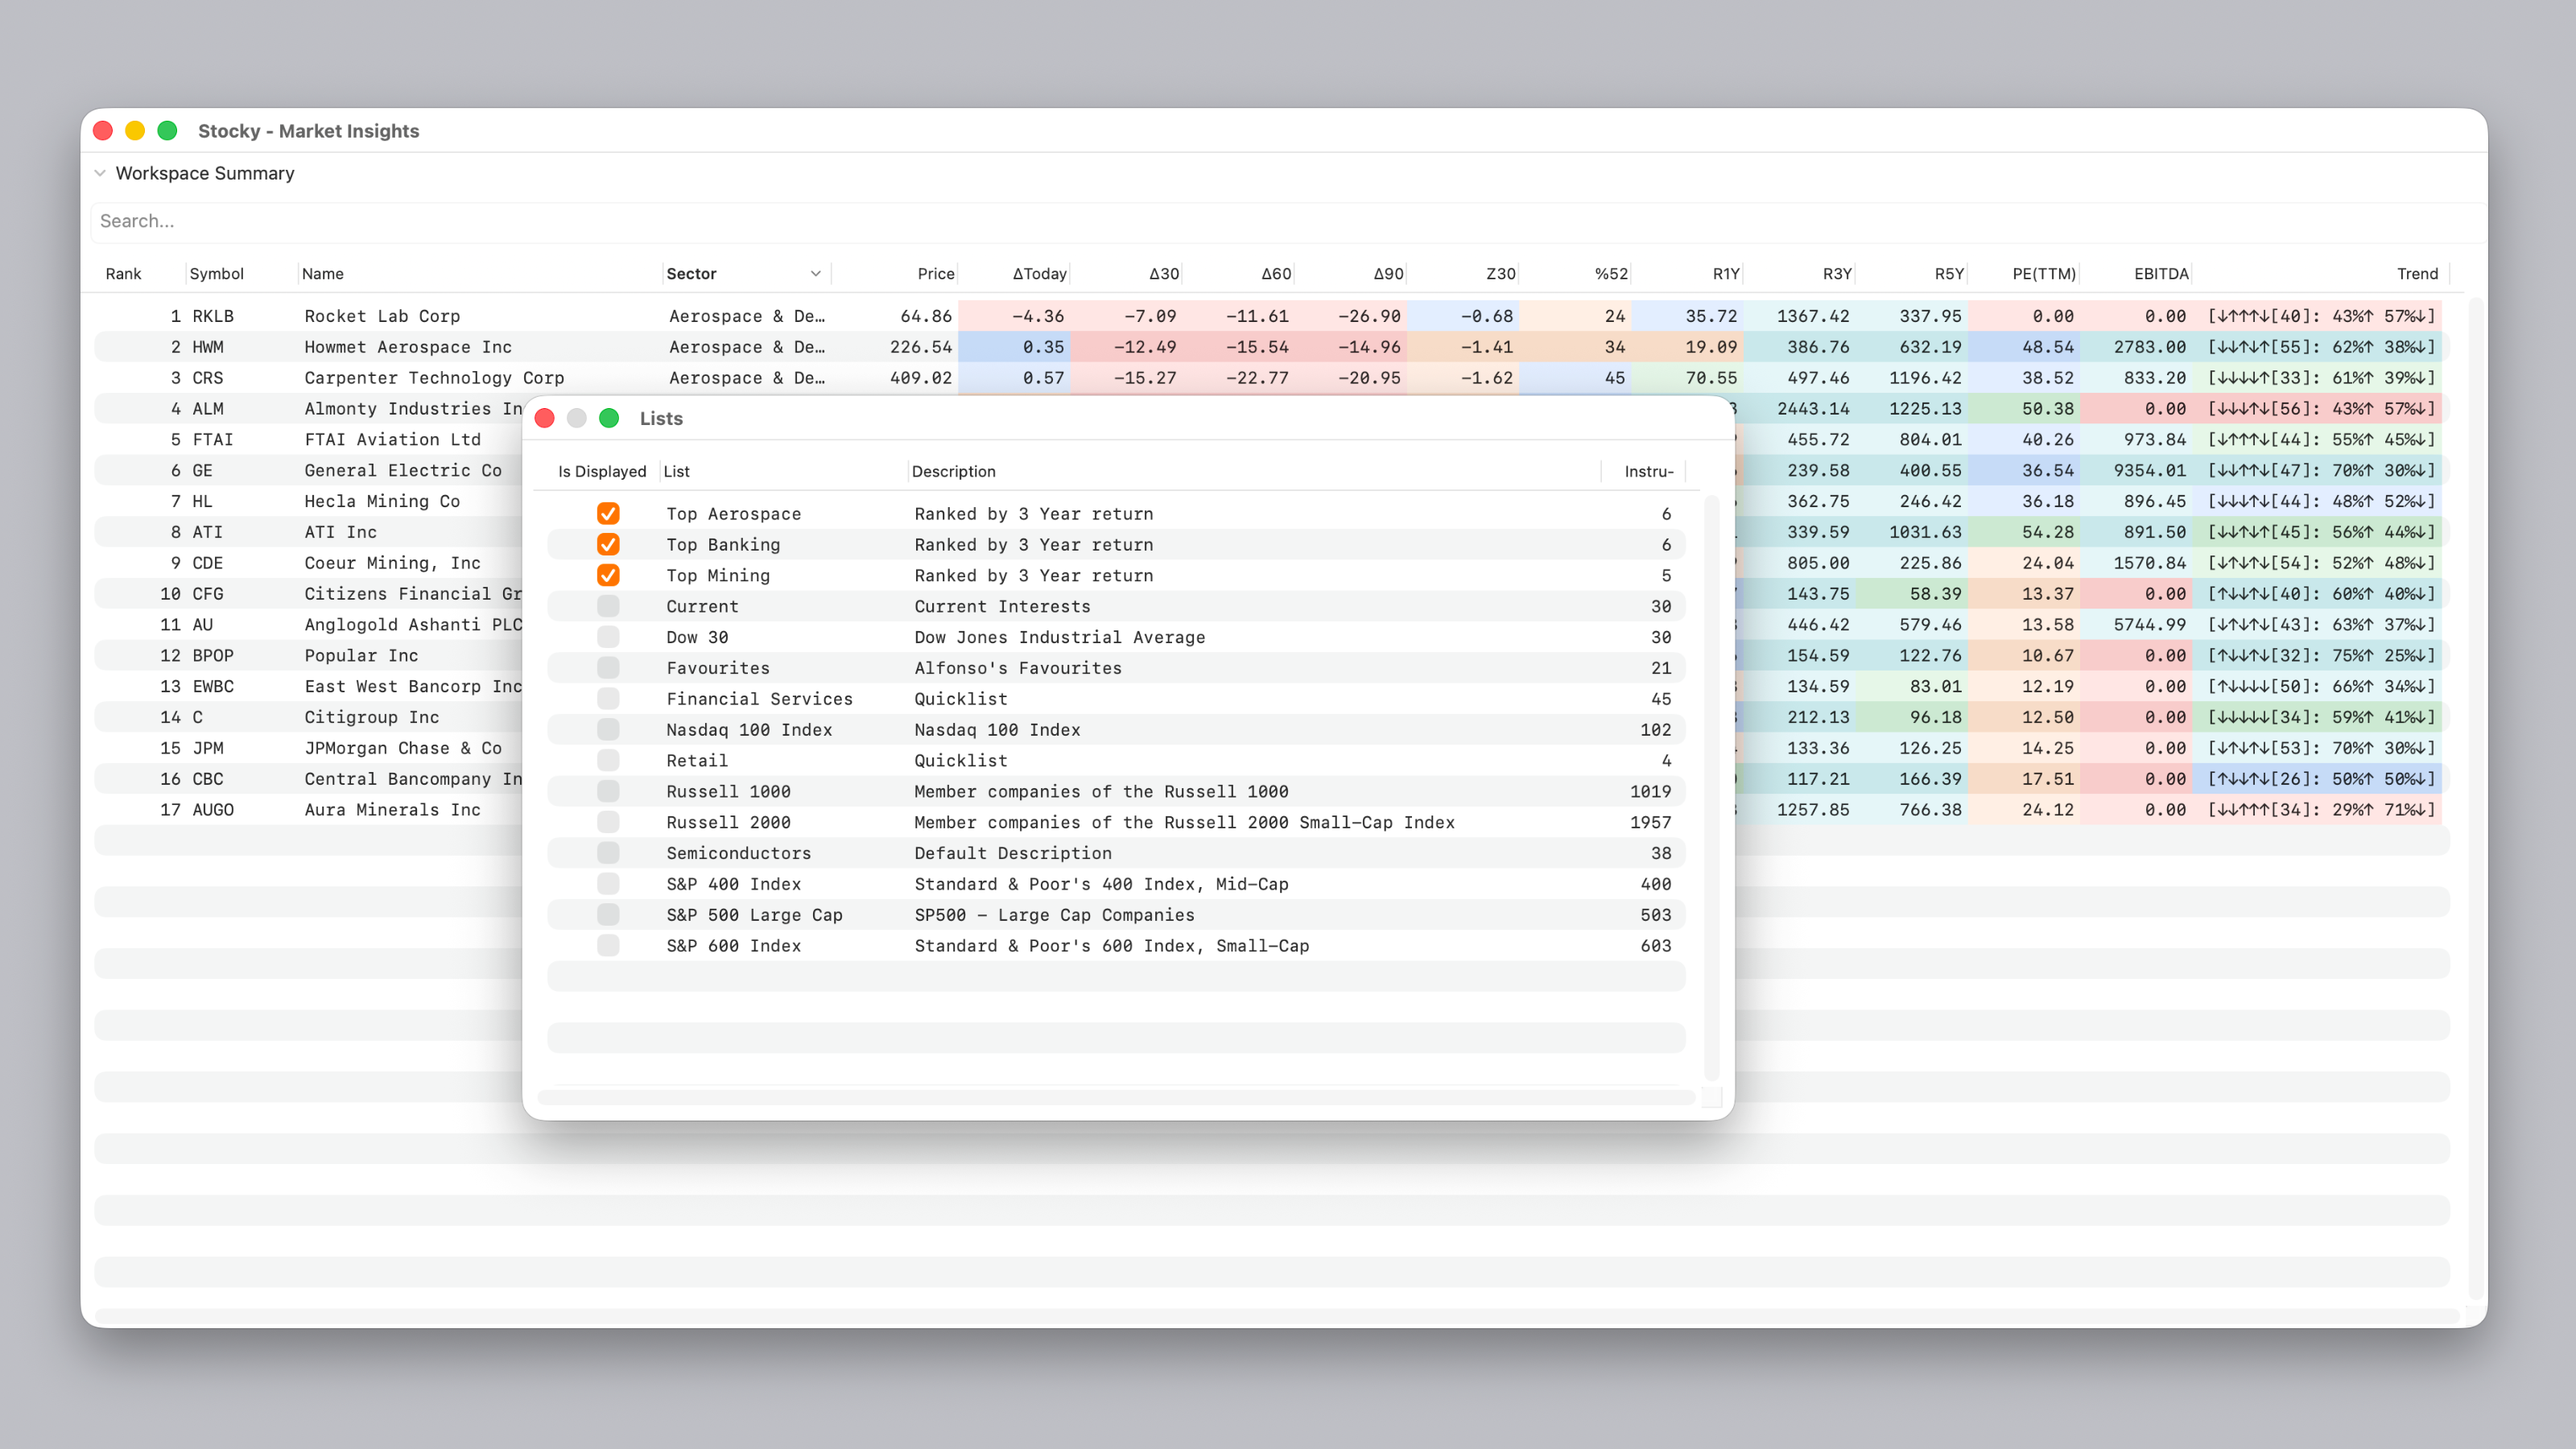
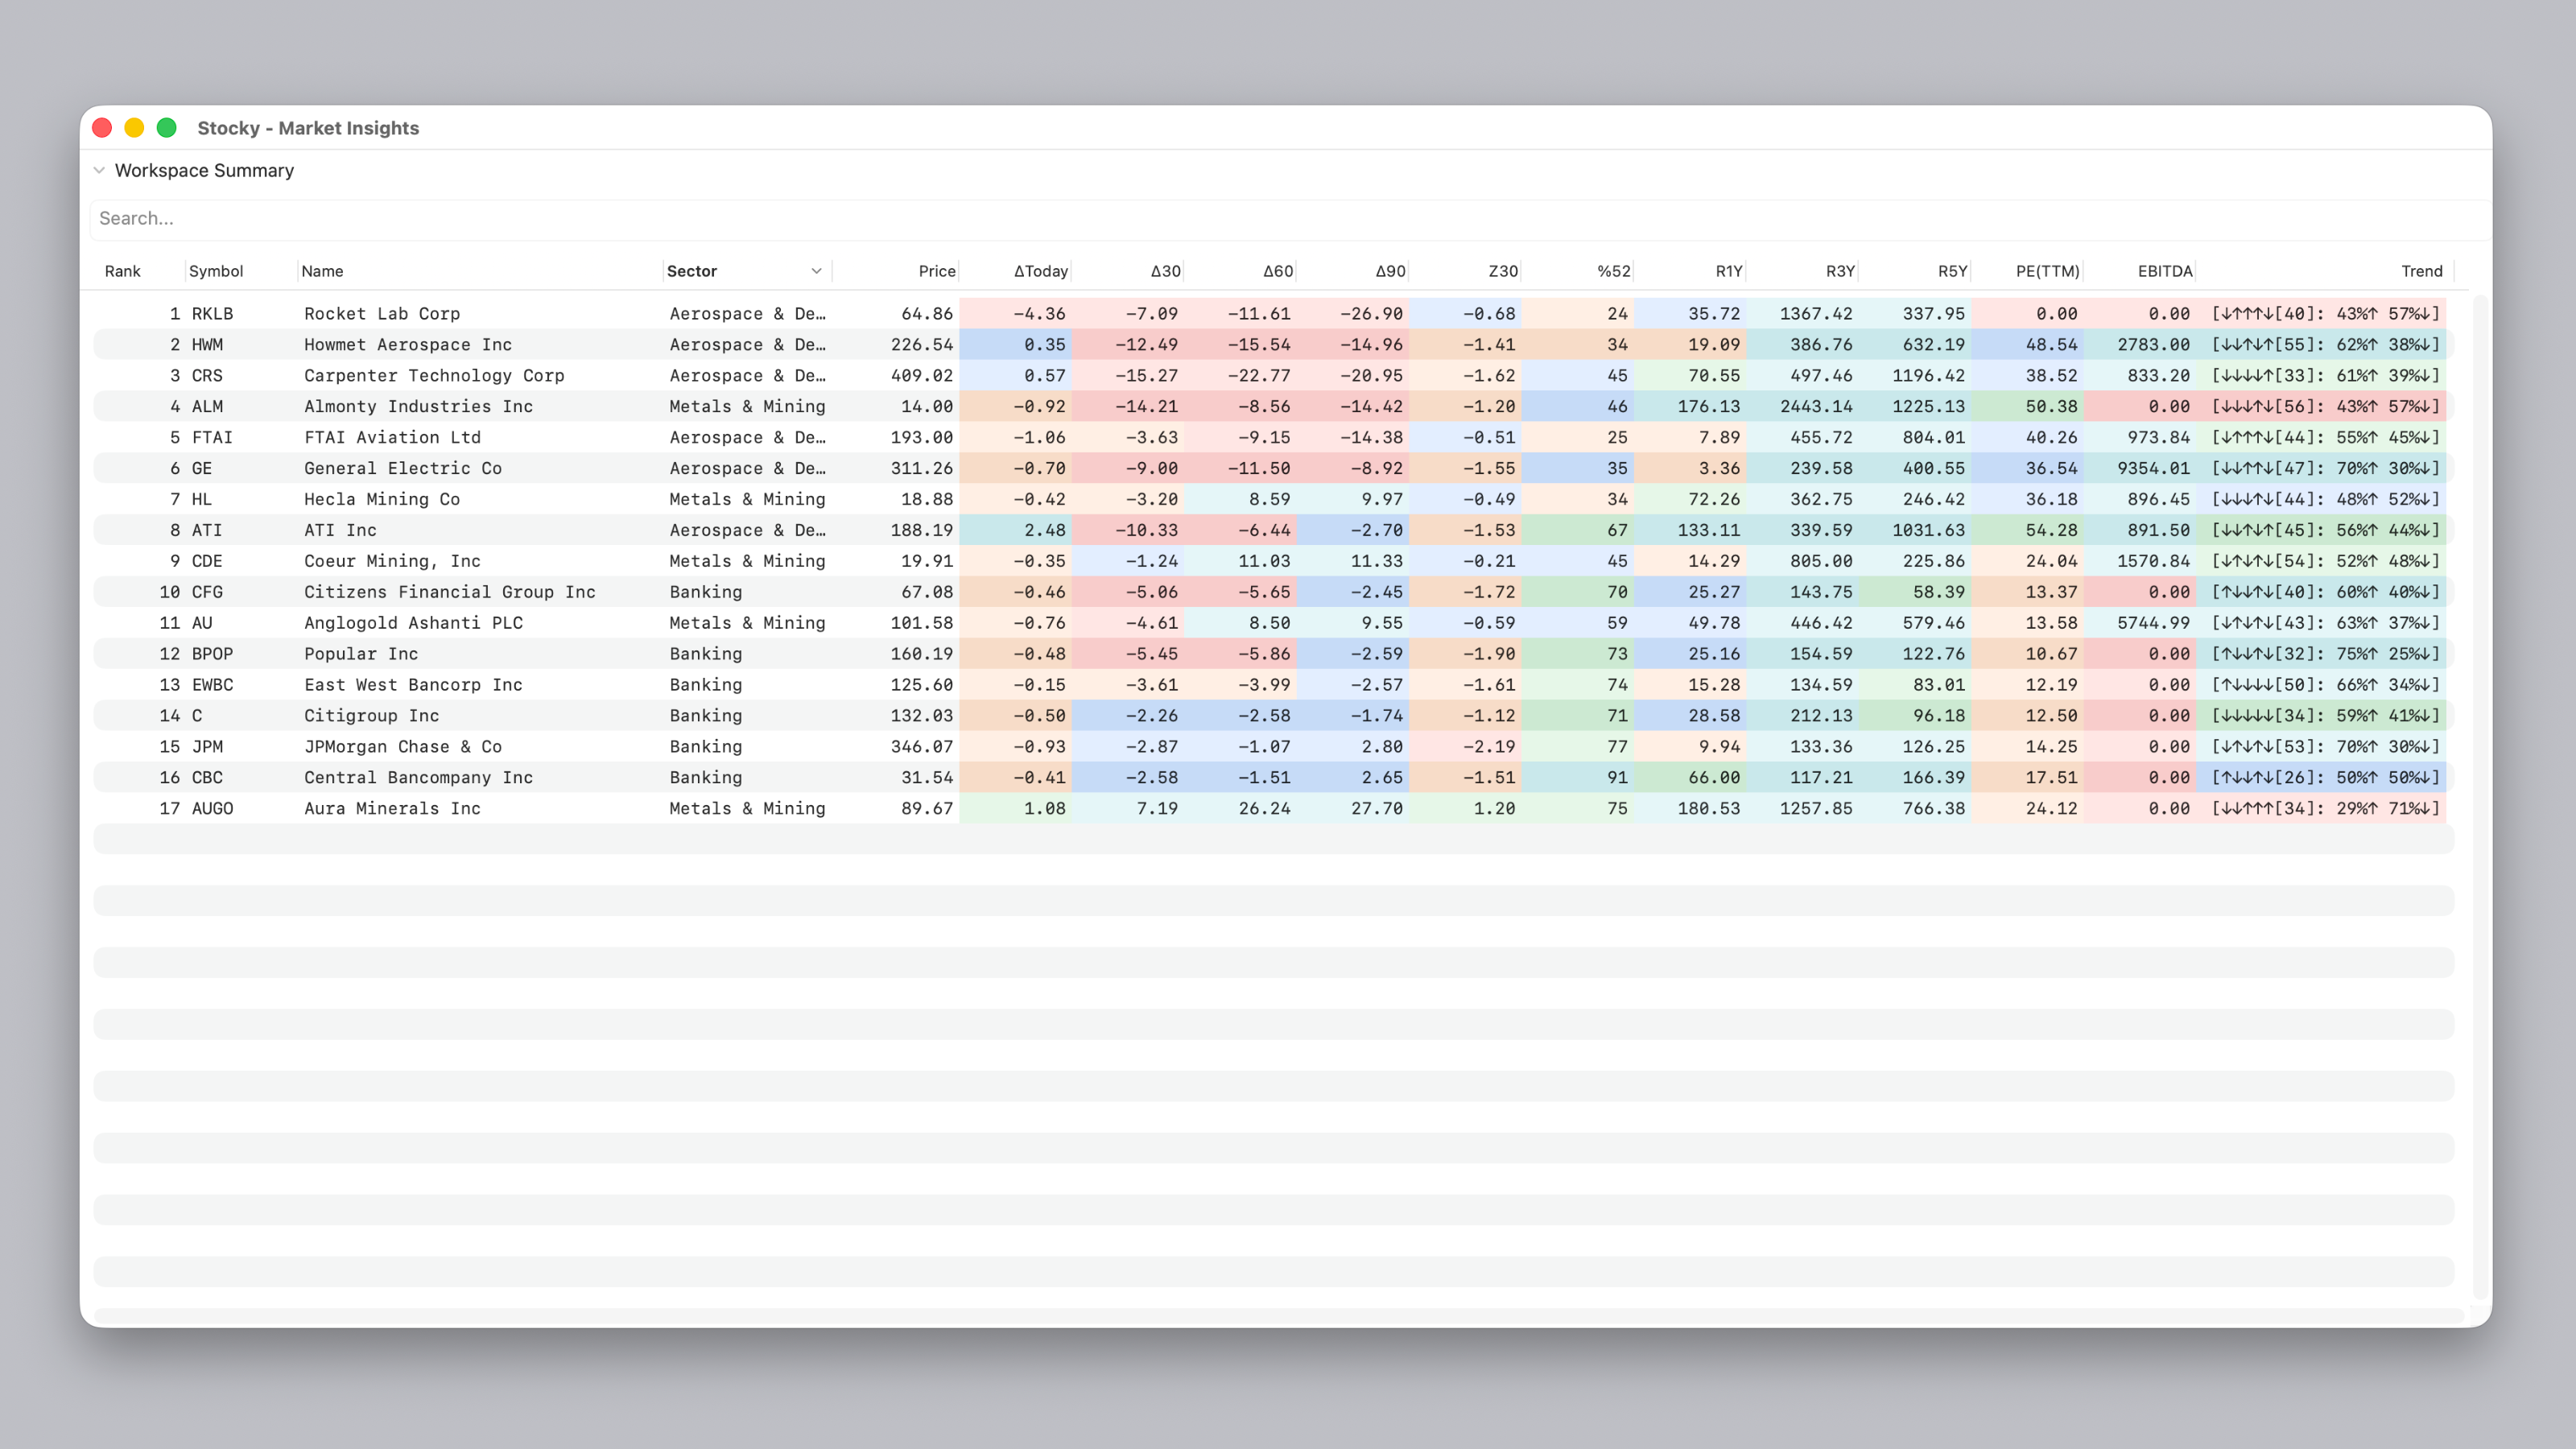
Chart View
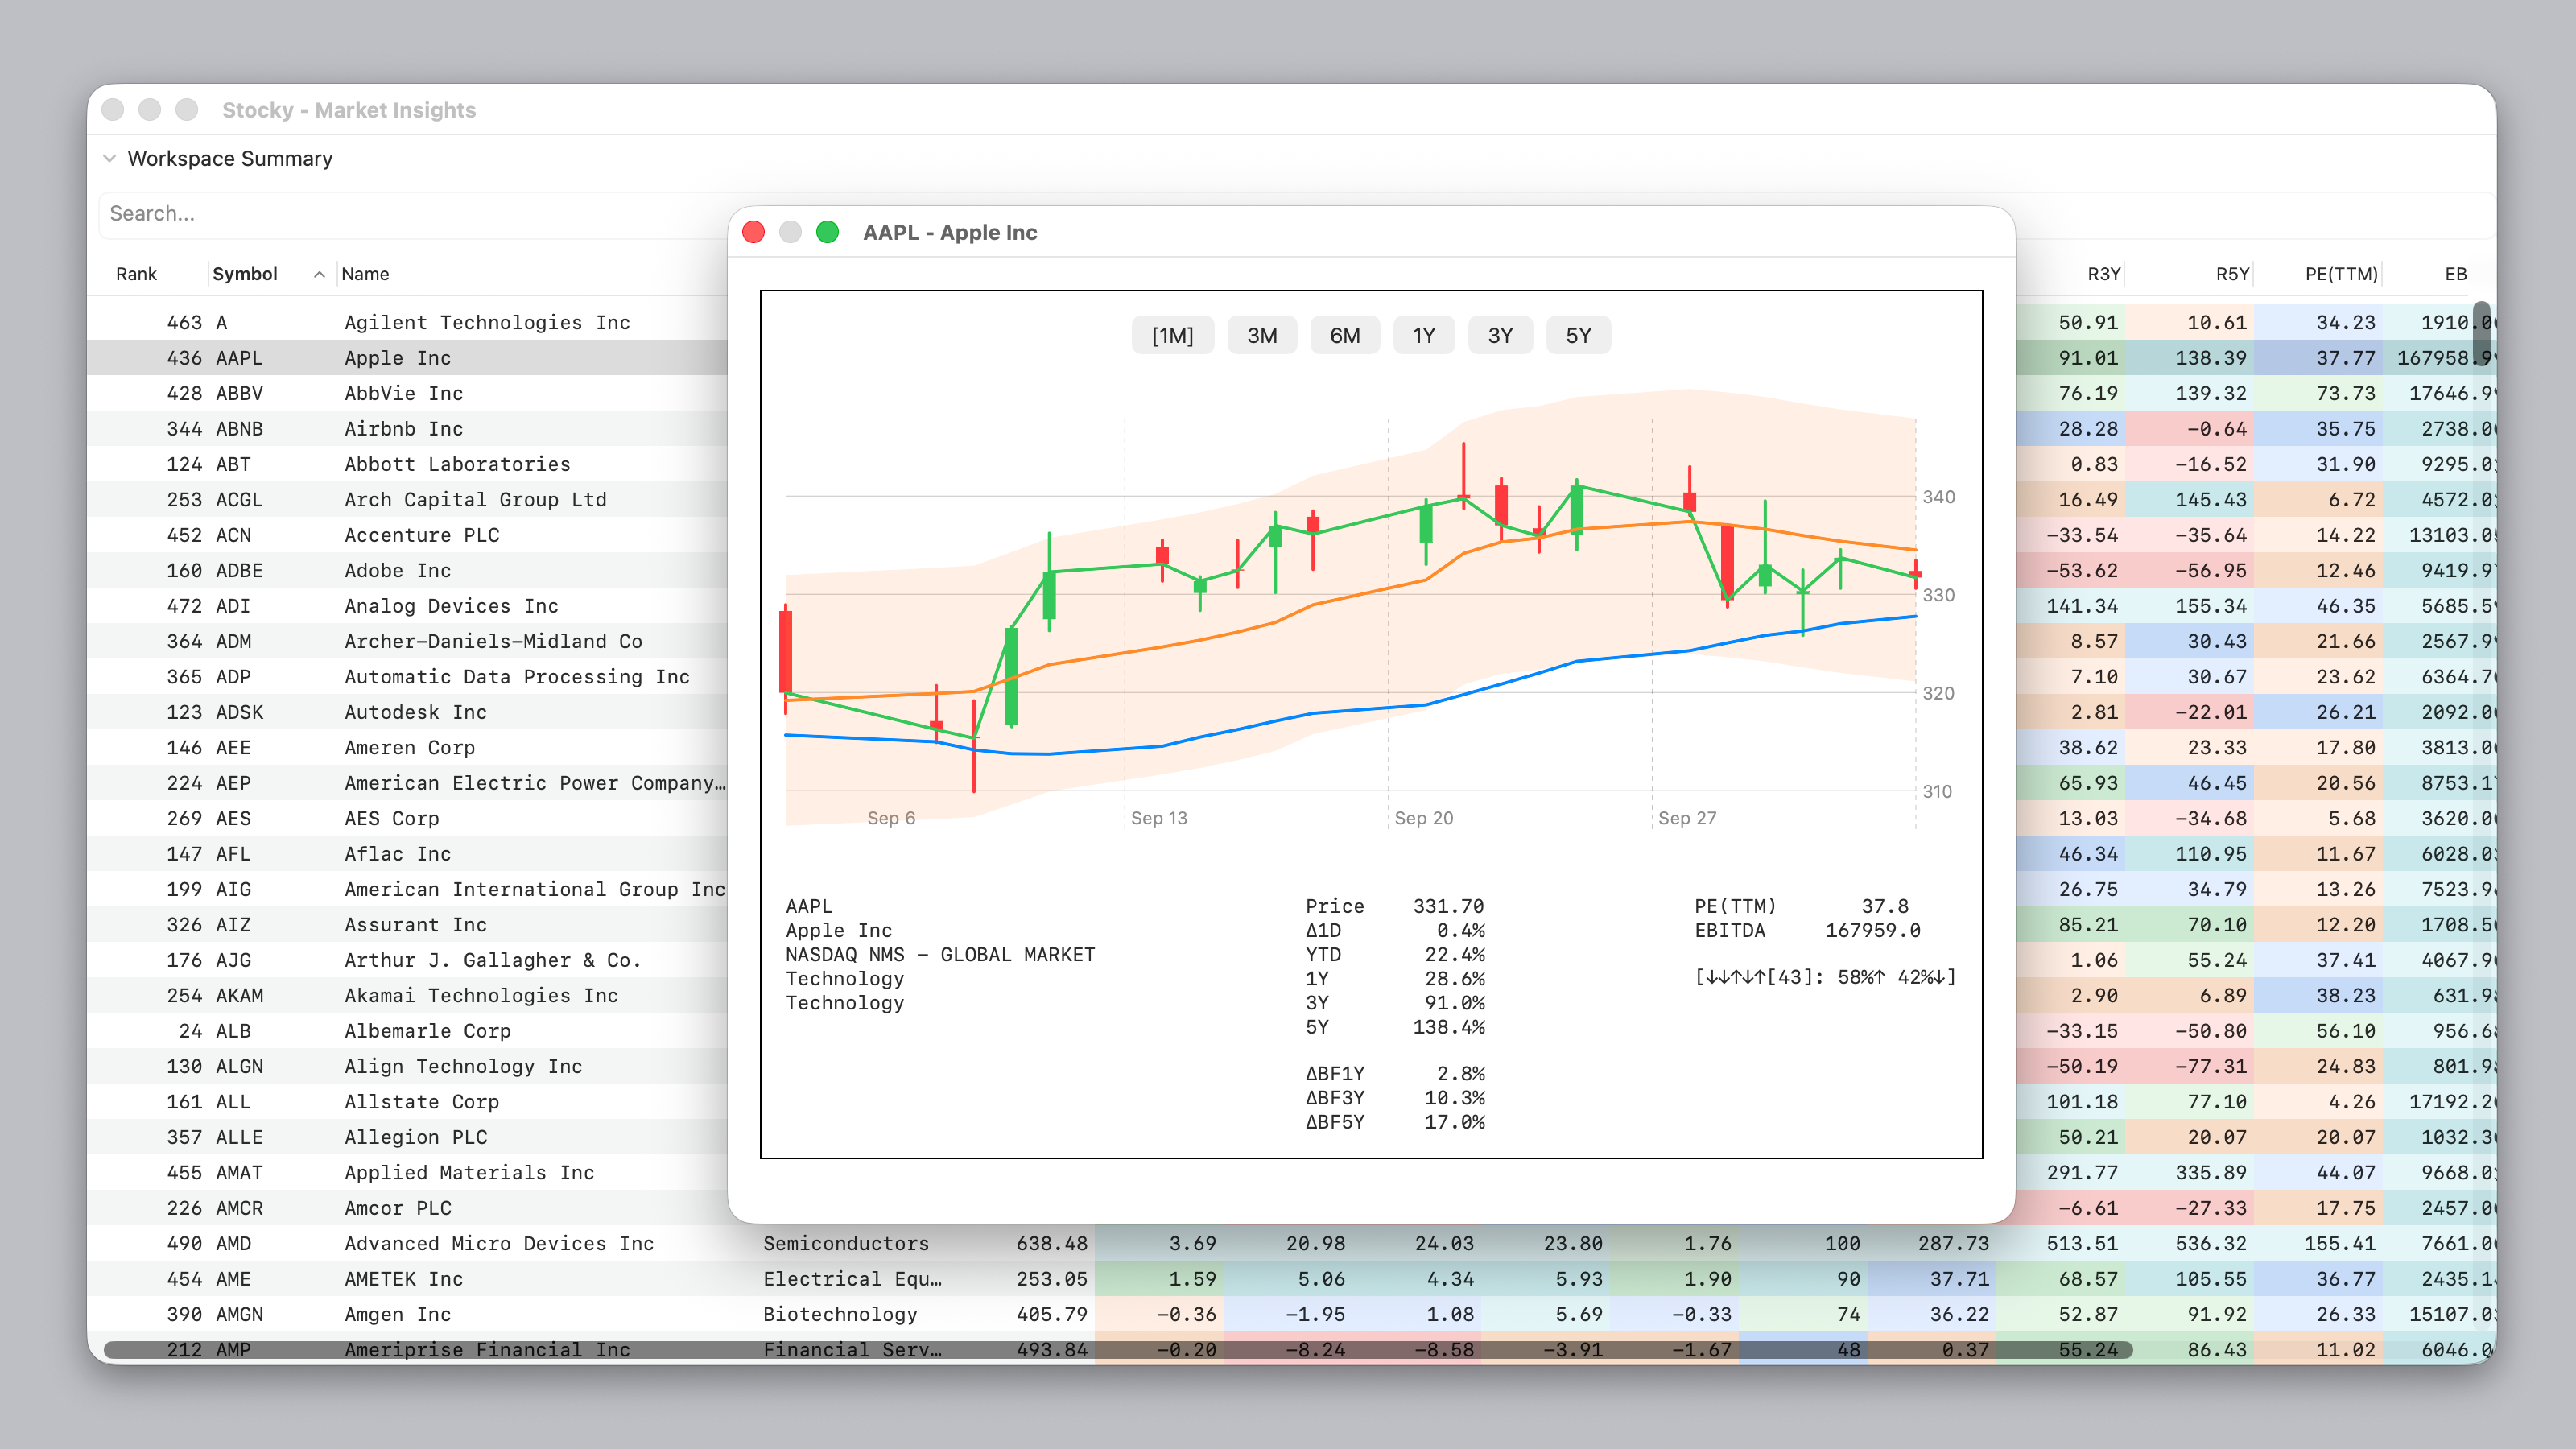
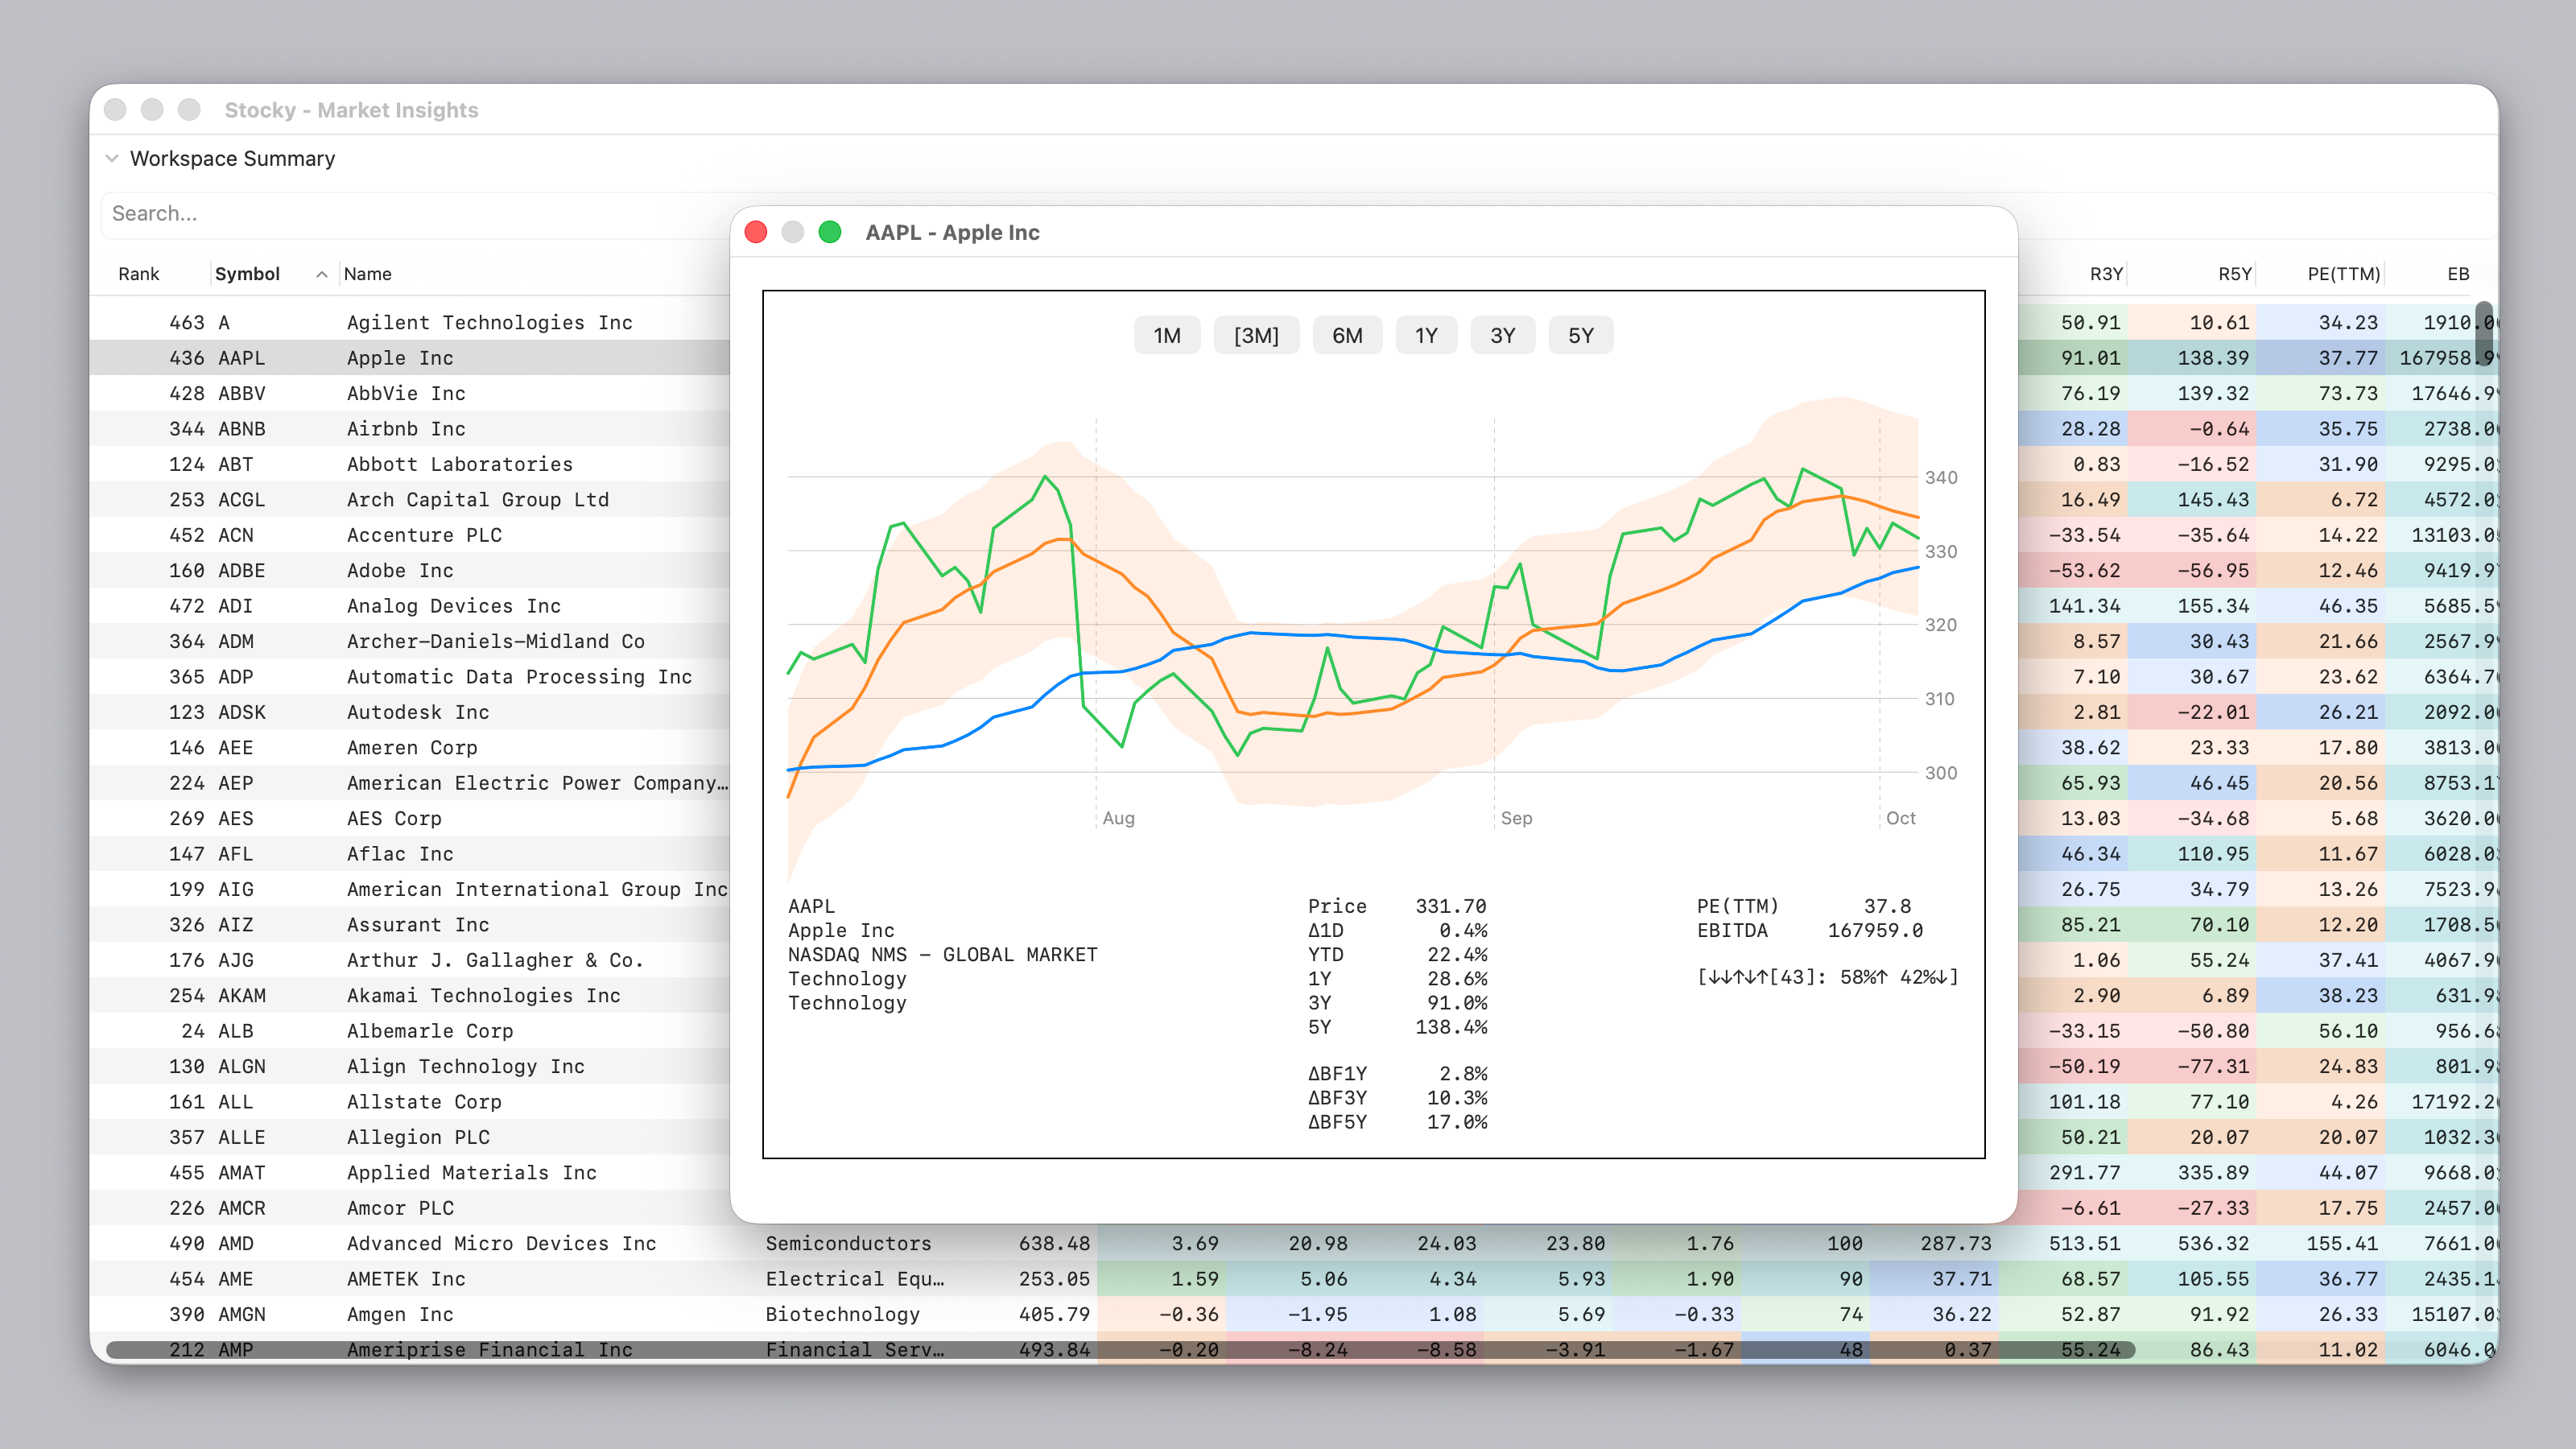
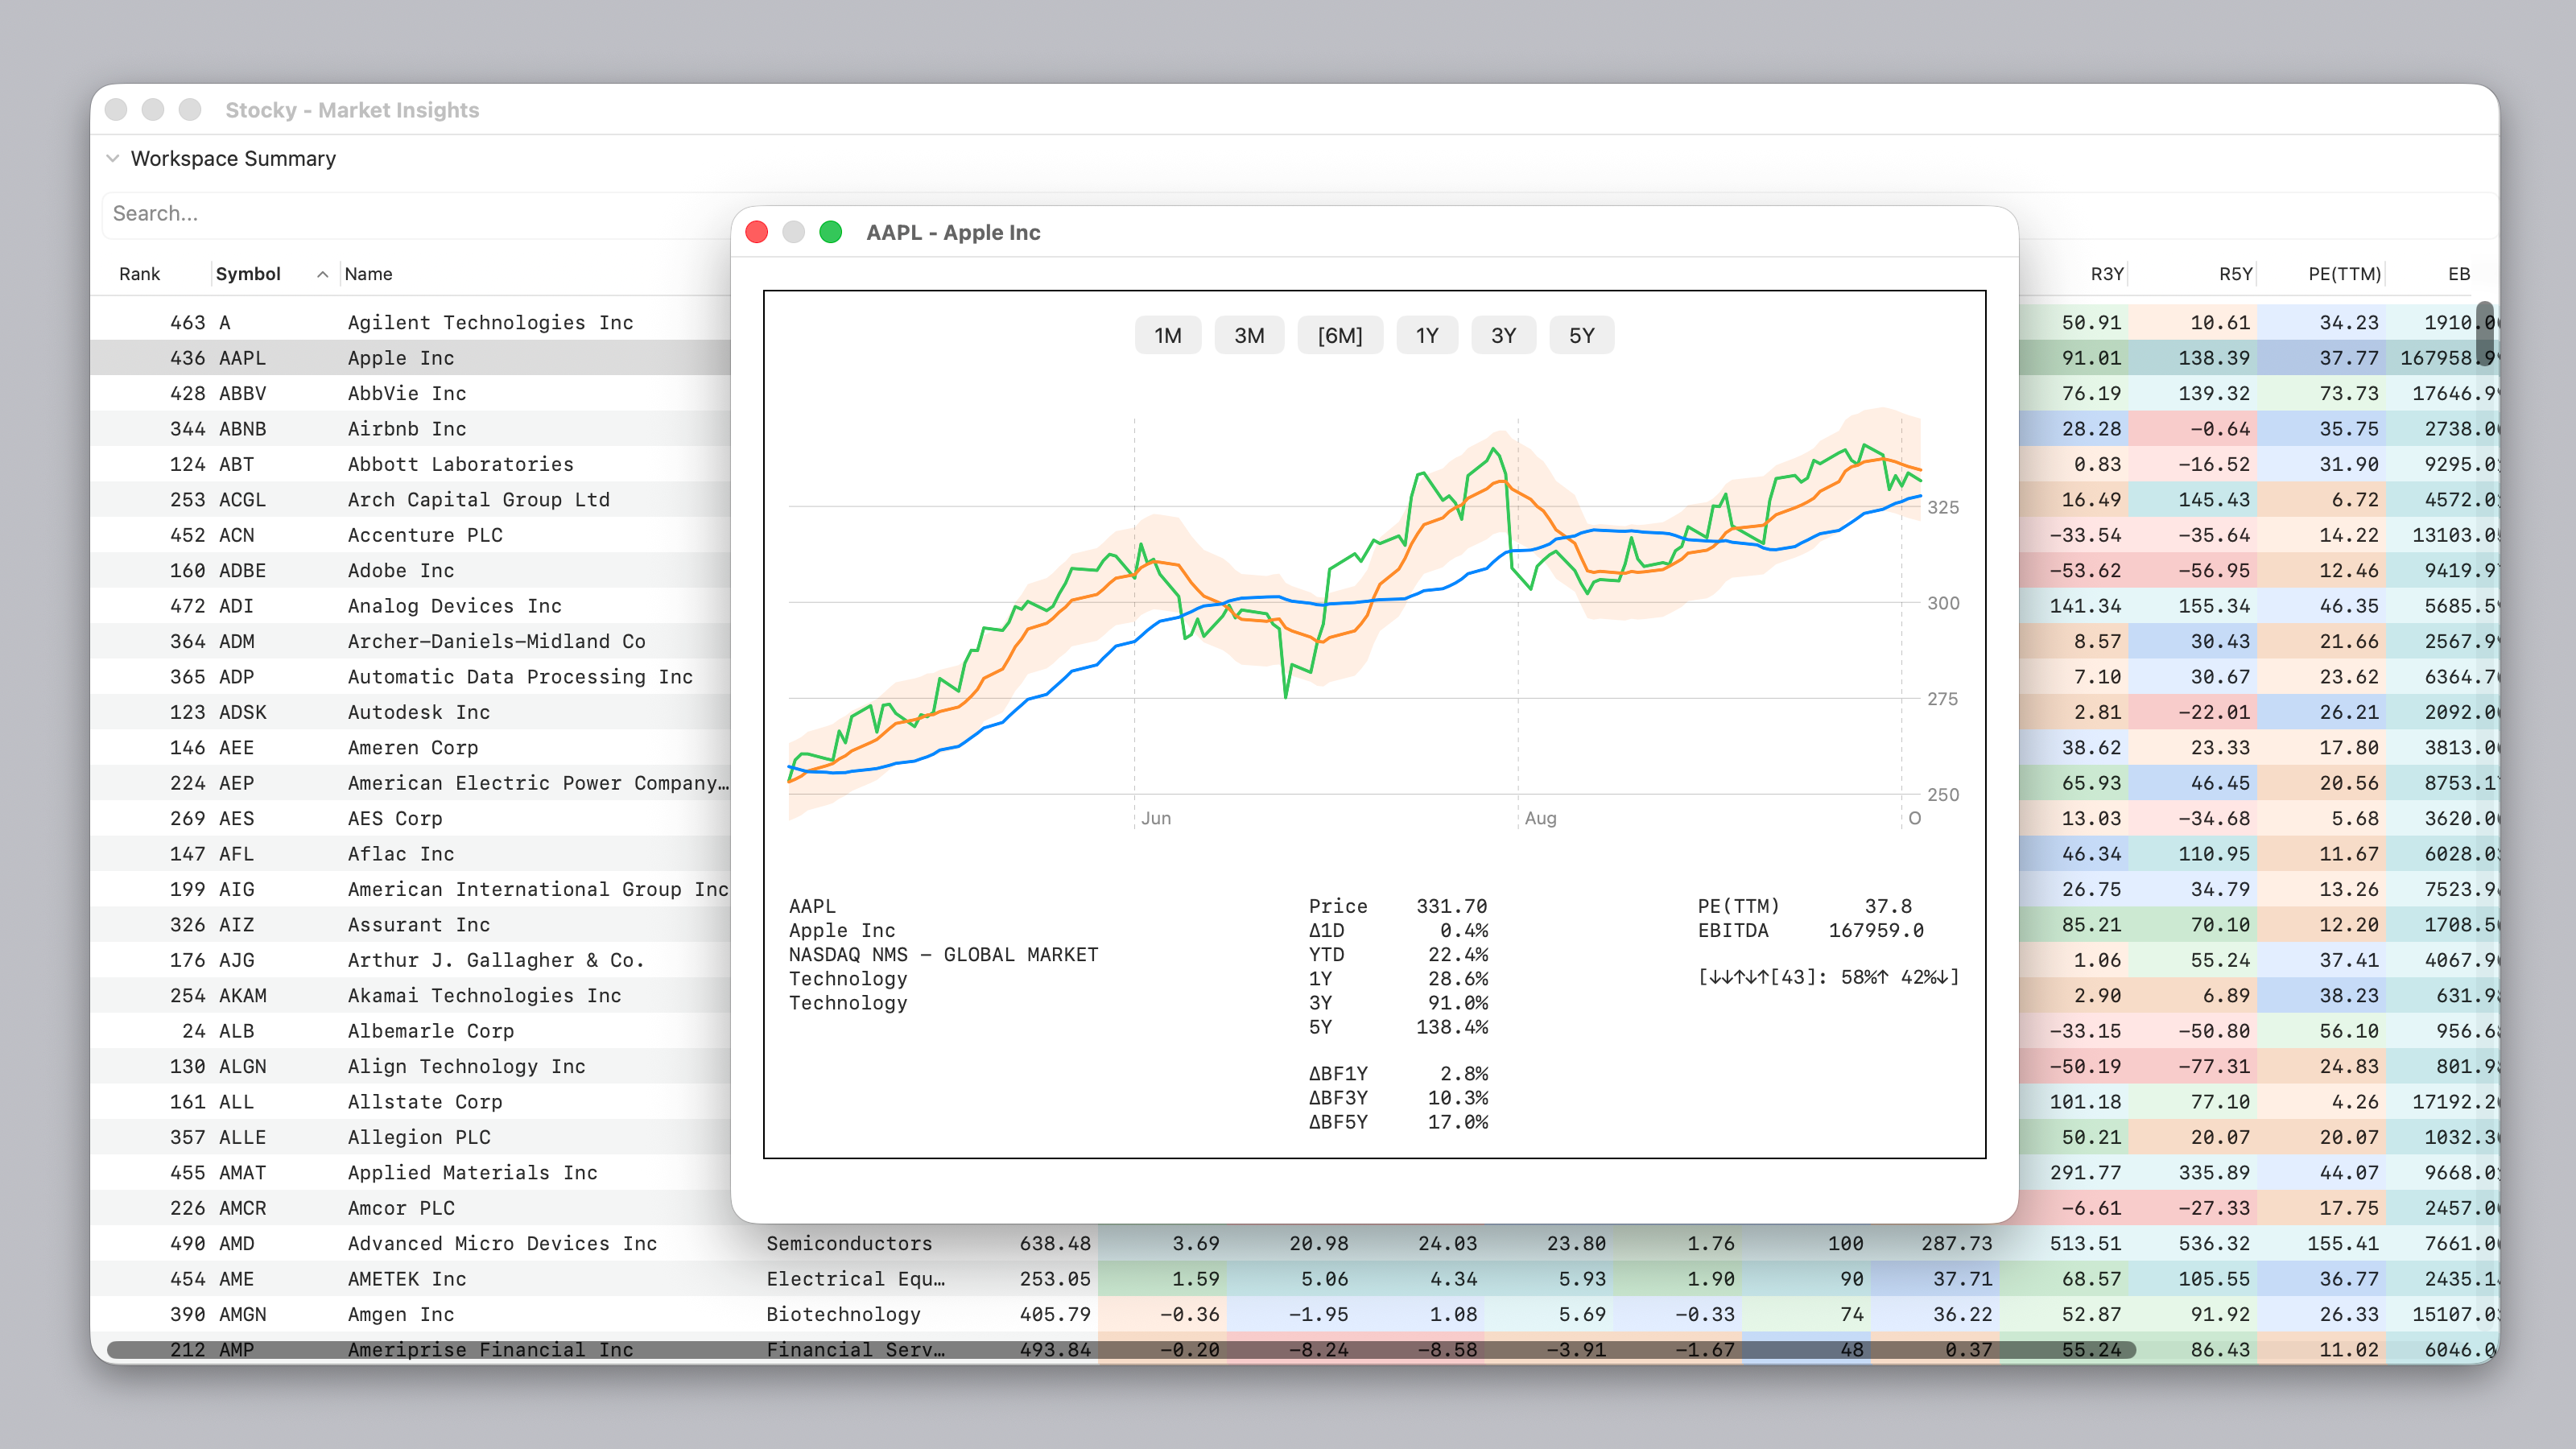
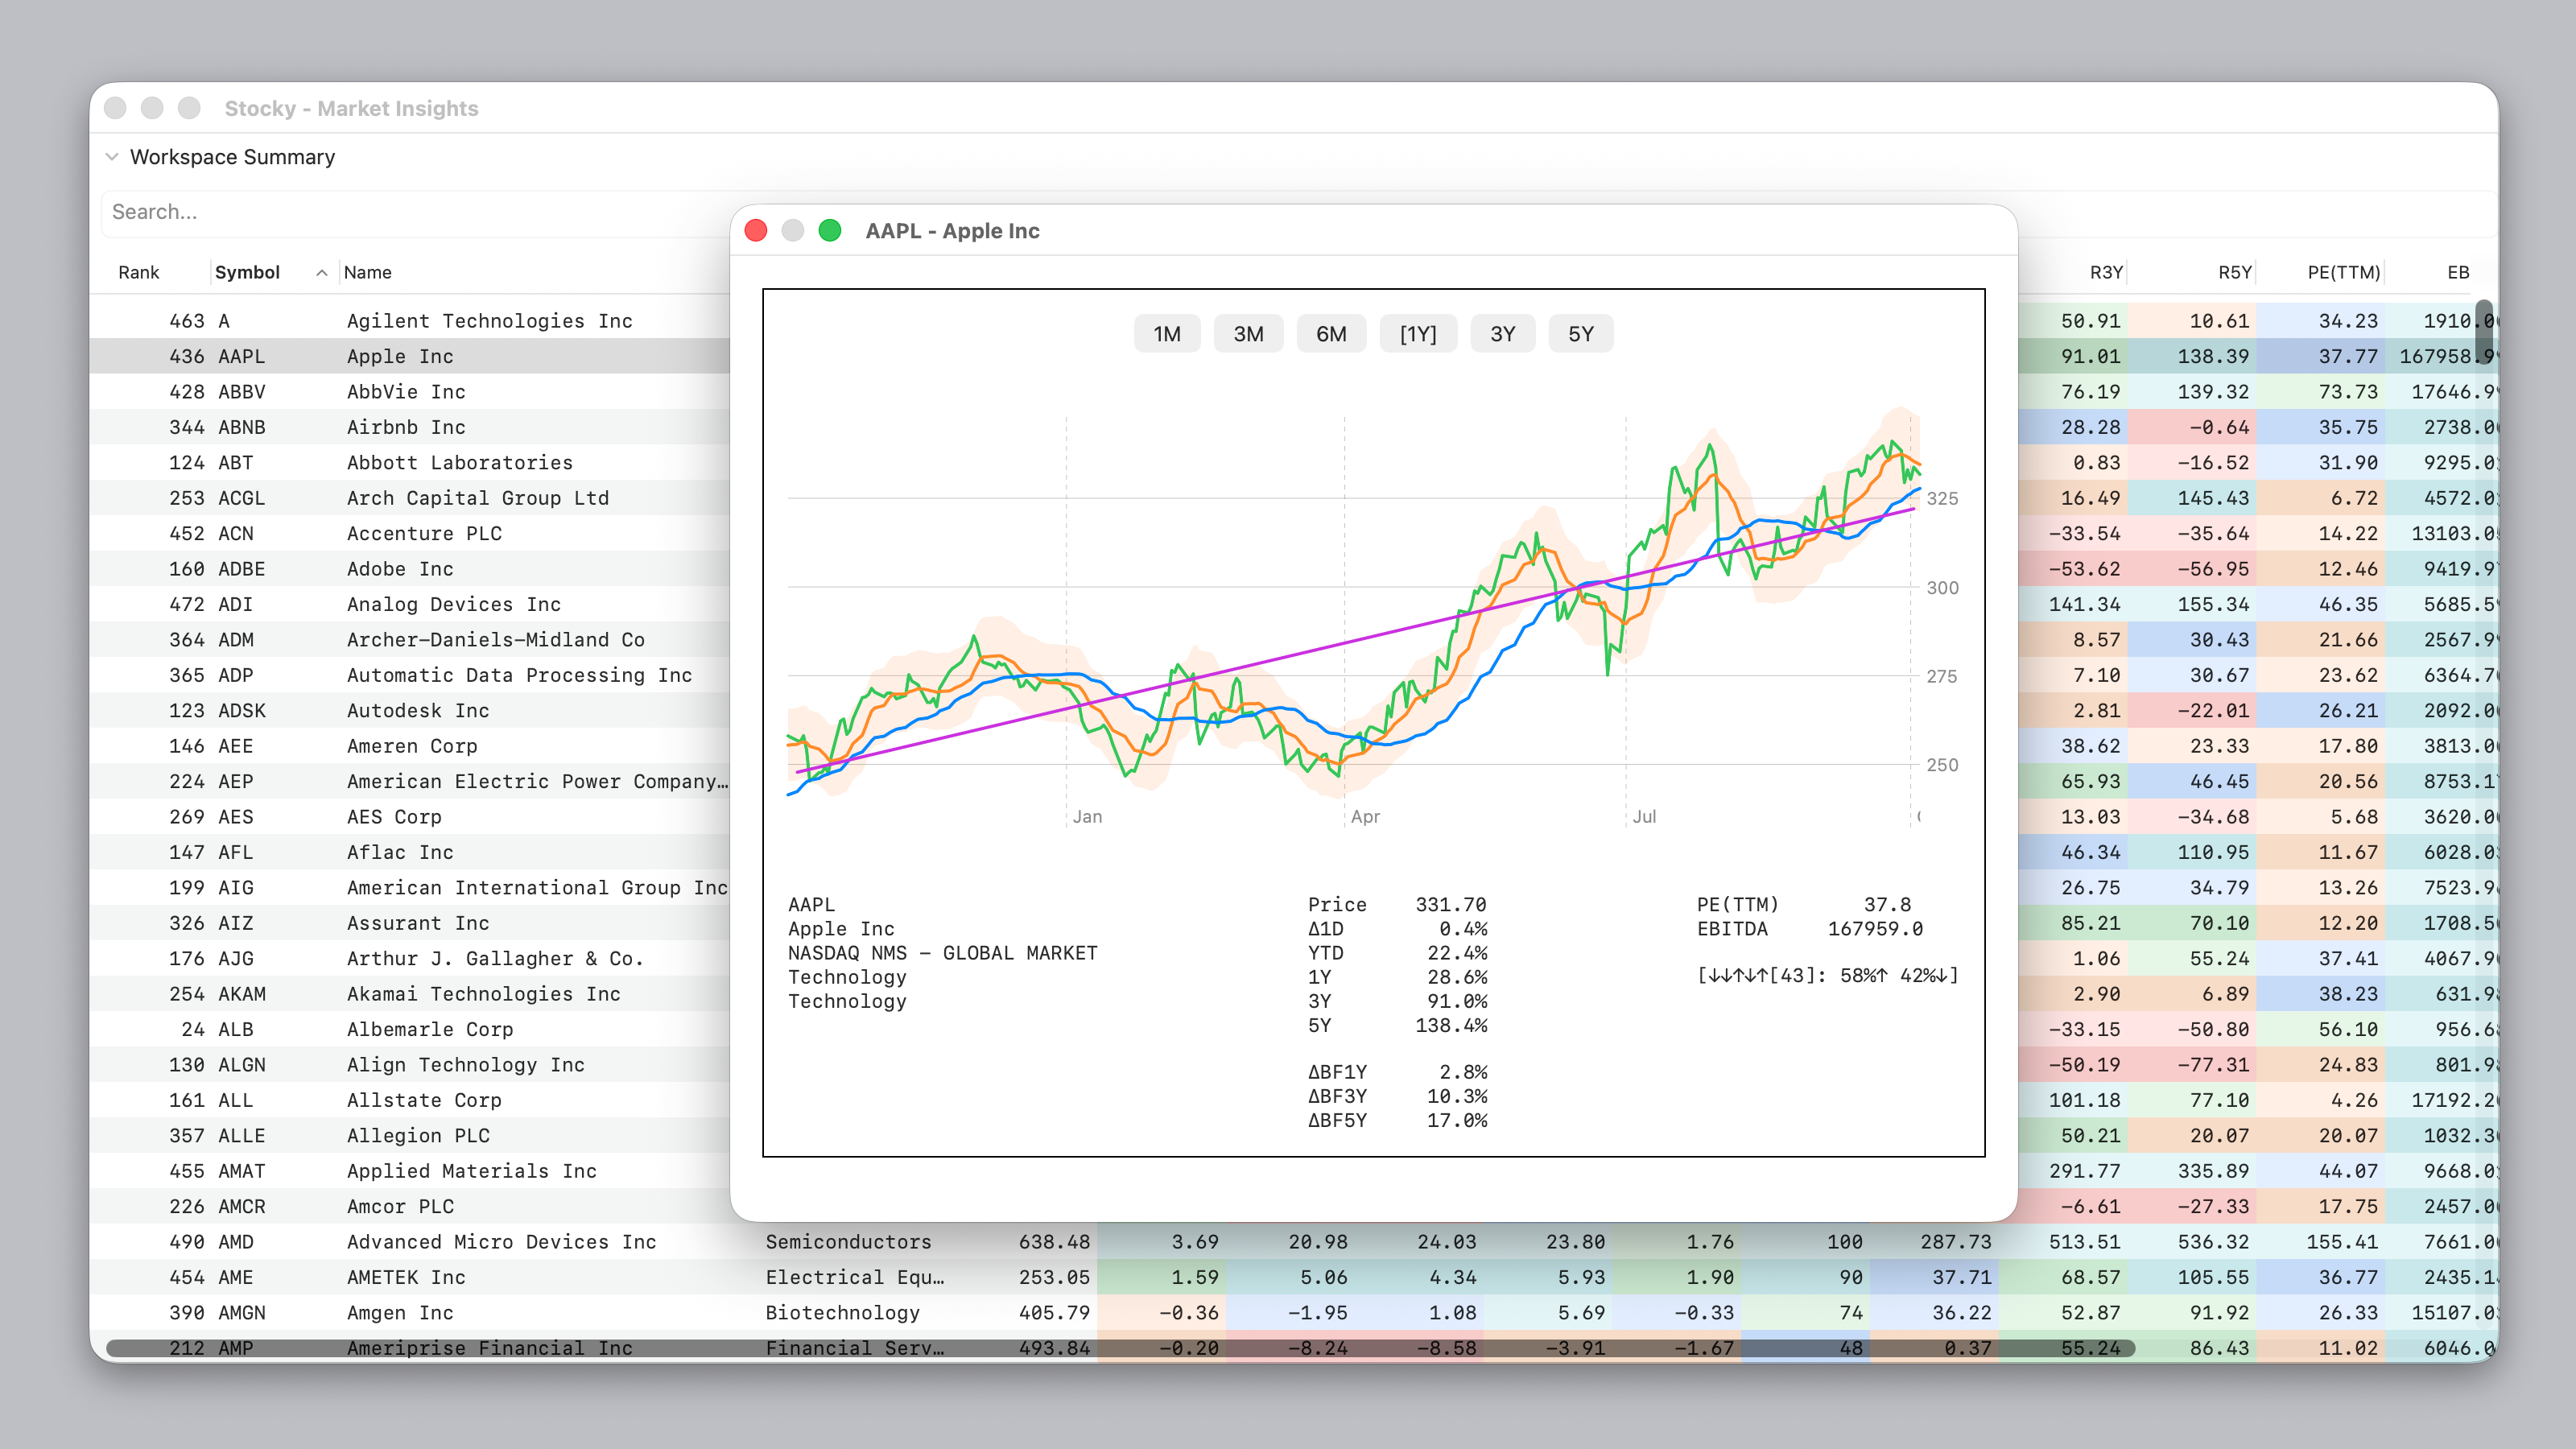
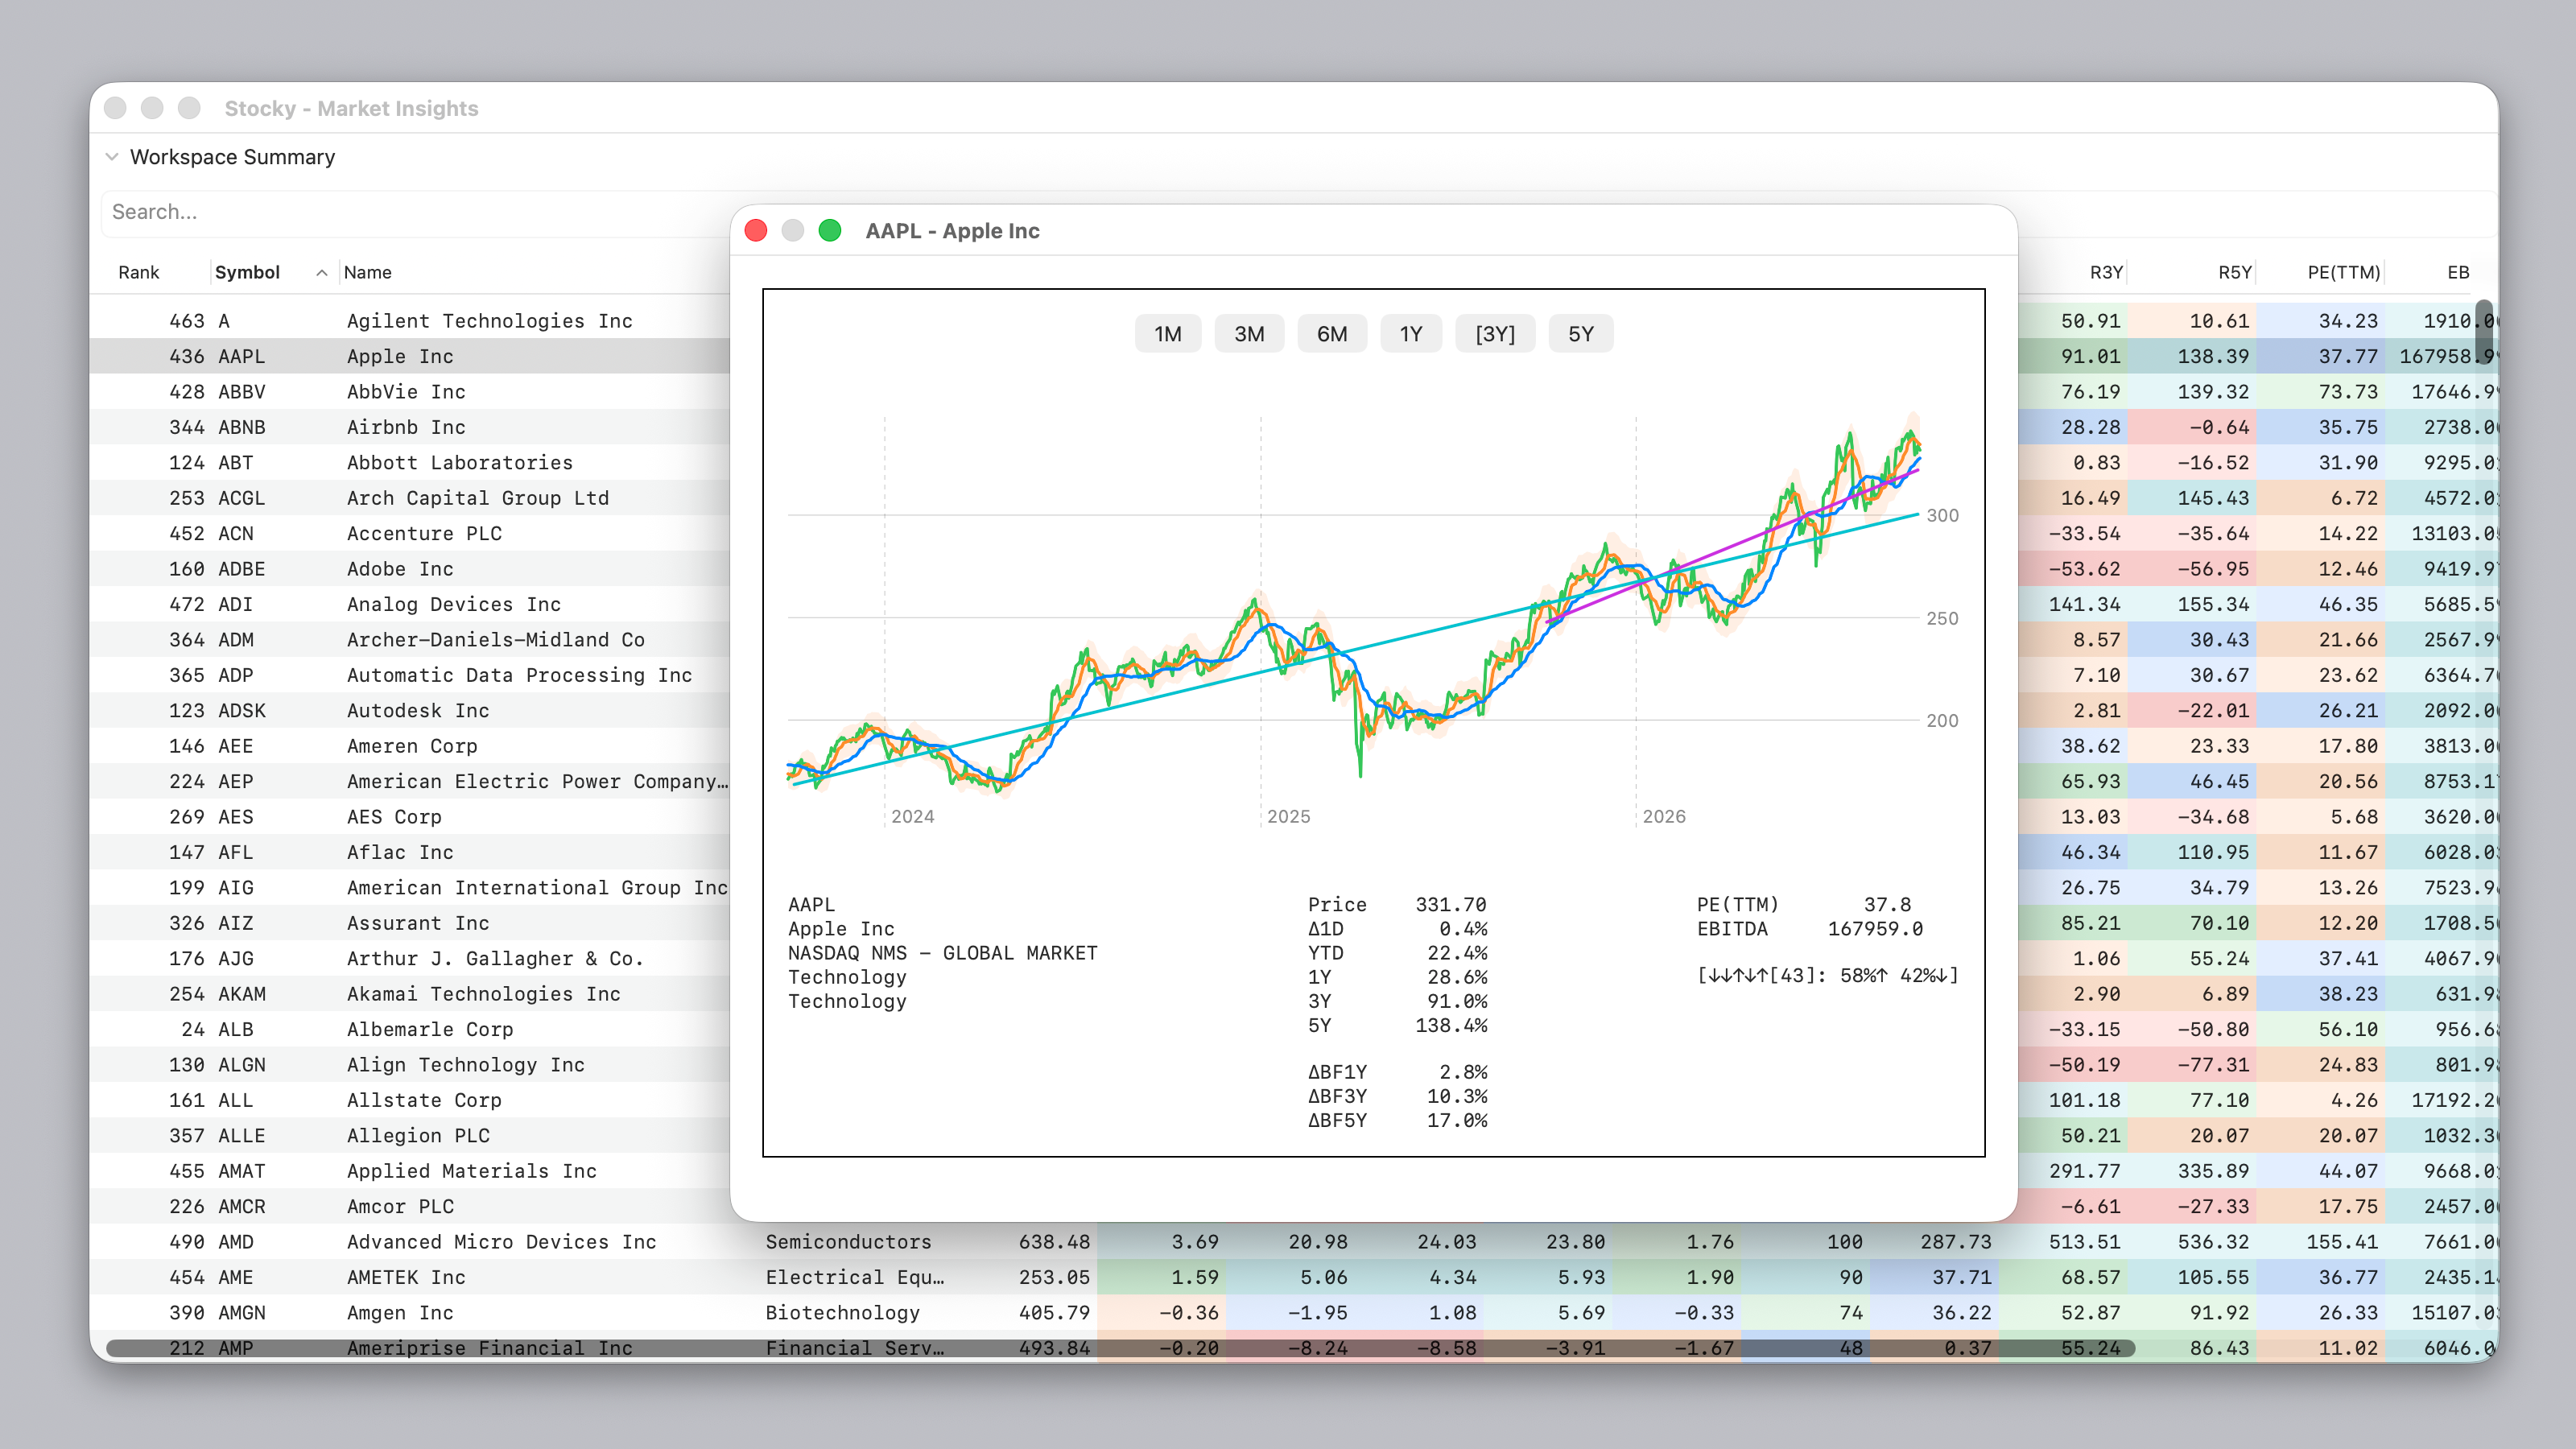
The graph view allows the user to see a graphical representation of the price history of the instrument over time. The graph view supports the following time views :
- 1M
- 3M
- 6M
- 1Y
- 3Y
- 5Y
In addition to the price history, the Chart View provides the following data points.
- Price
- 1 Day price change
- YTD price change
- 1Y (calendar) price change
- 3Y (calendar) price change
- 5Y (calendar) price change
- Variance from 1 Year Best Fit Line
- Variance from 3 Year Best Fit Line
- Variance from 5 Year Best Fit Line
- PE(TTM) - Price/Earnings Trailing Twelve Months
- EBITDA
On the chart itself are represented the current price, the 30 day moving average, the to day moving average envelope and (if the timeline is large enough) the one year, three year and five year best fit lines.
Filters
Filters are used to simplify the Workspace view so that you are only shown the Instruments that you want to see. They can be stacked and controlled individually.
Currently implemented.
- 3 year performance
- 5 year performance
- 20 day volume
- Price/Earnings.