Trend Pattern Model
Trend
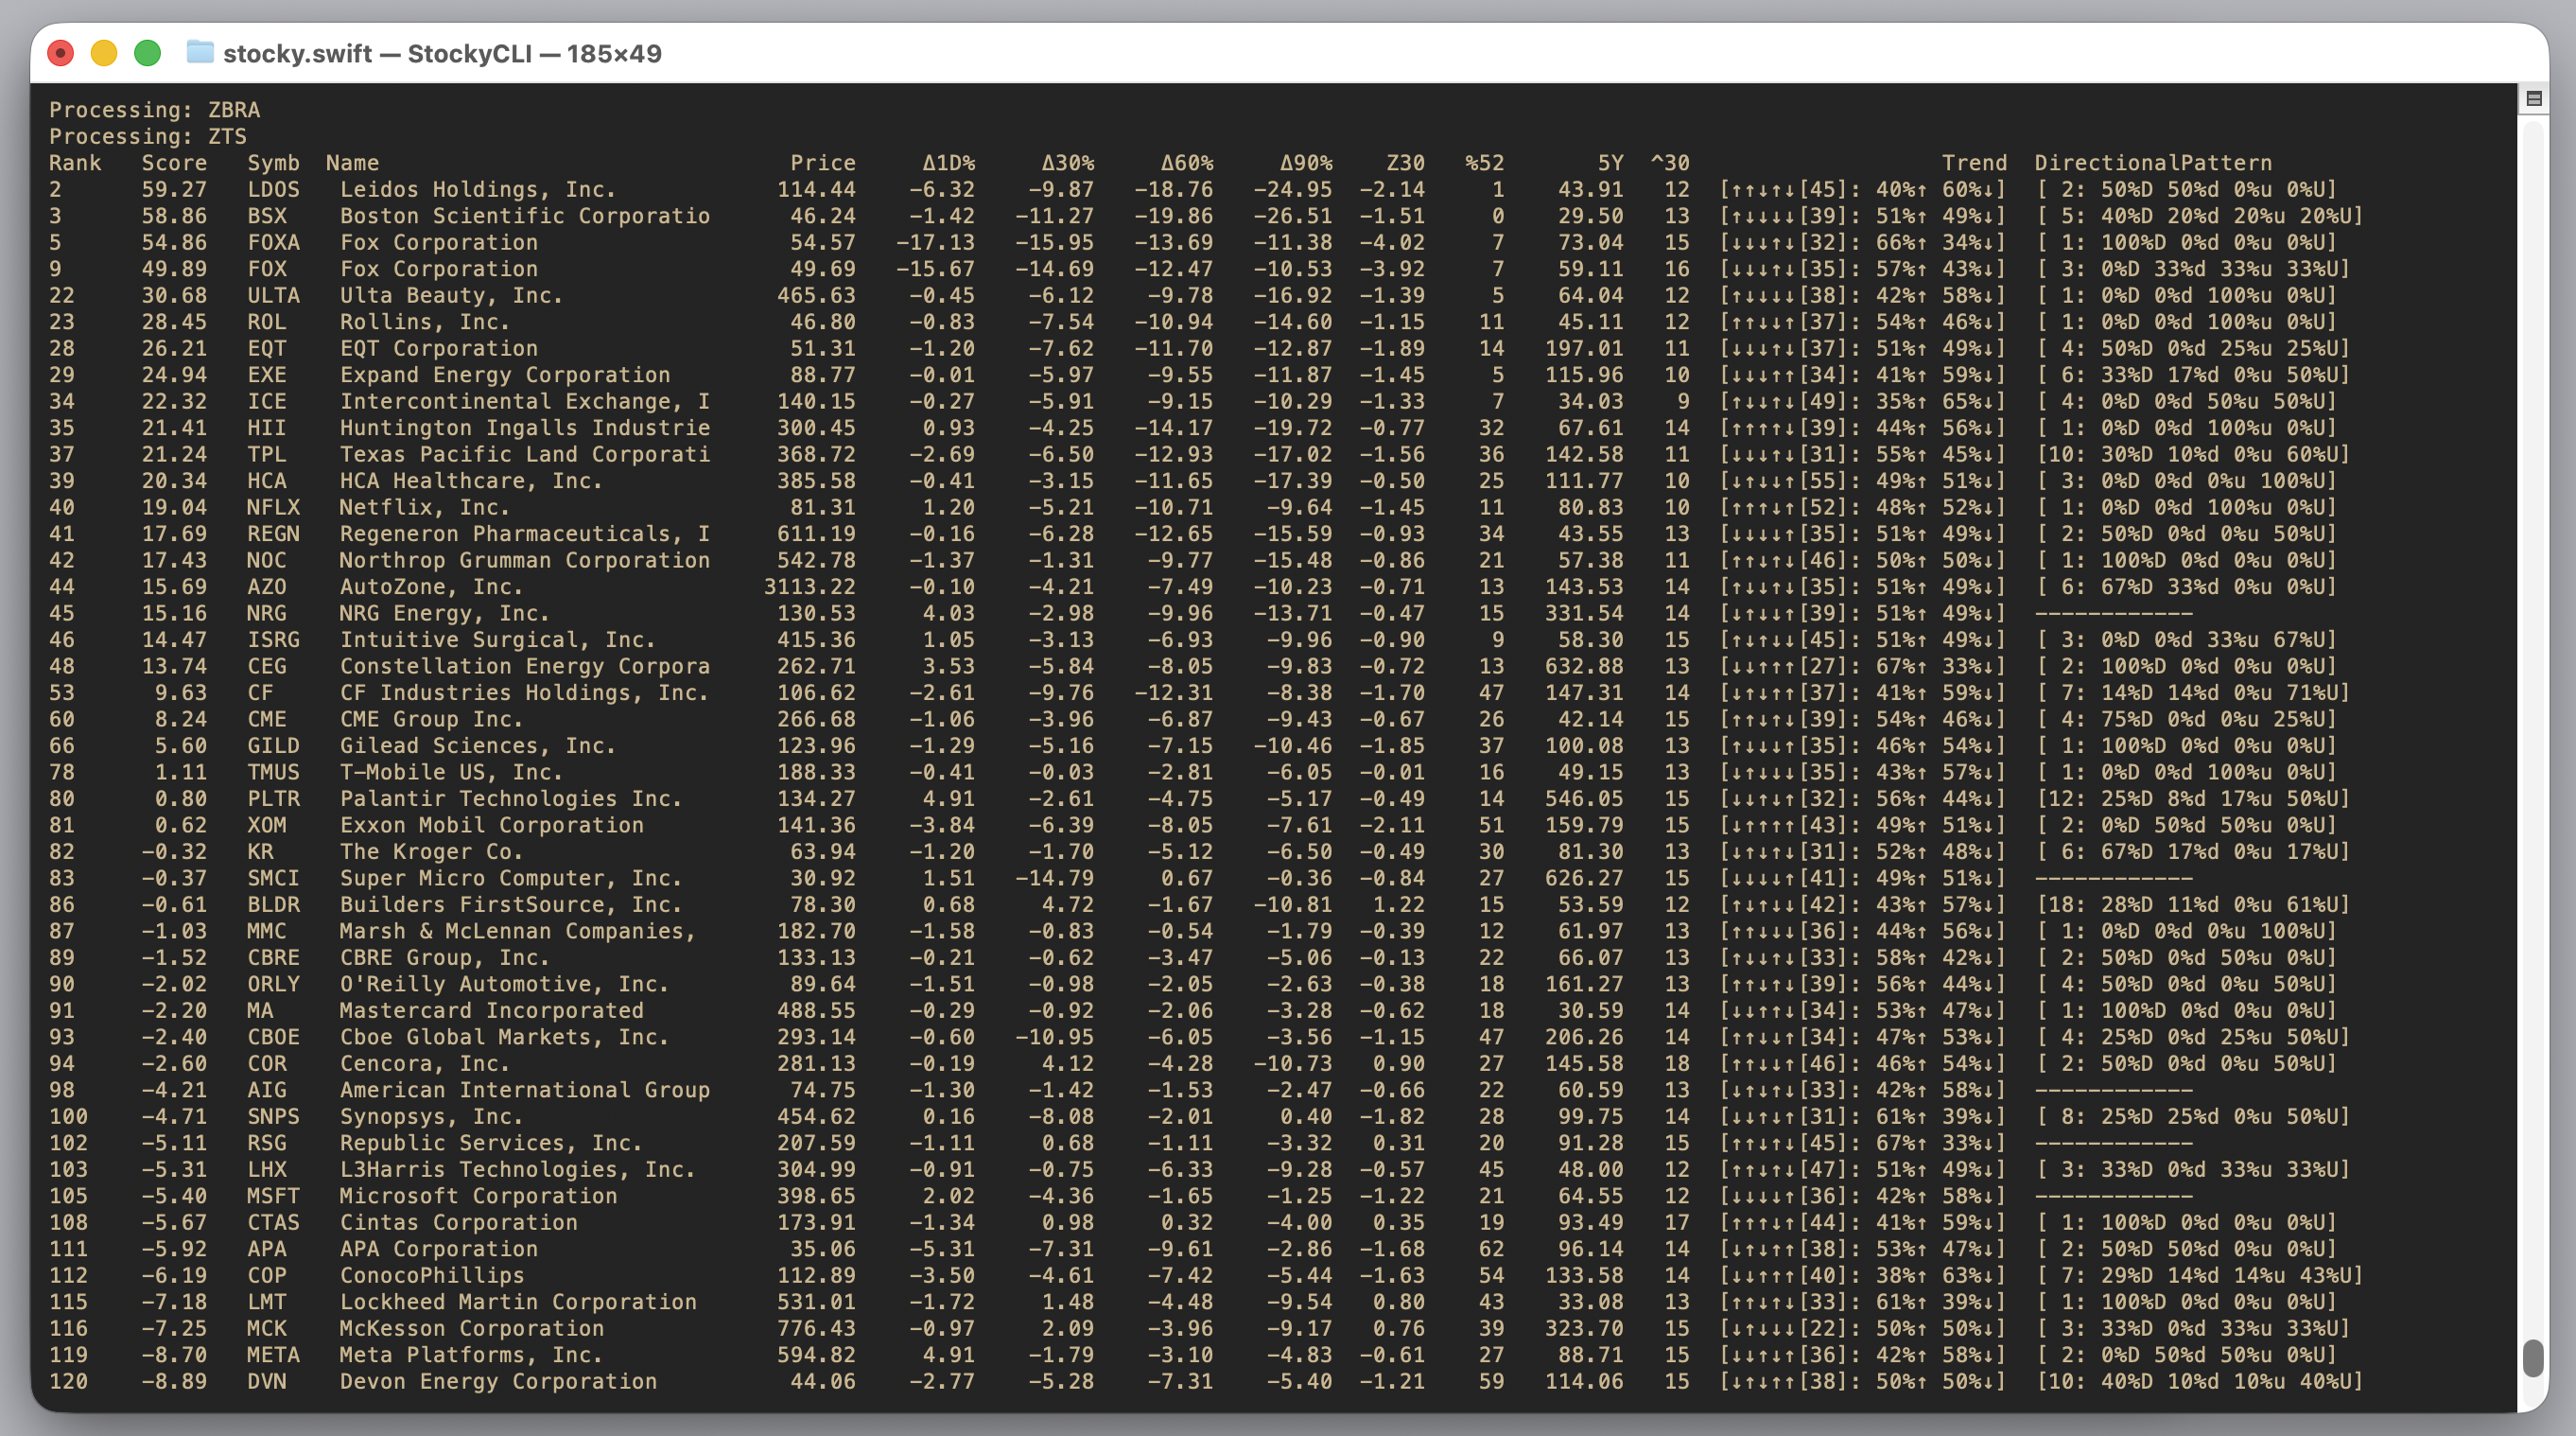
[↑↑↓↑↓[45]: 40%↑ 60%↓]
Experimenting with a trend pattern model. This is conceptually similar to a Markov chain in that it attempts to estimate the probability of the next state based on the current sequence of states. But it doesn't build a formal transition matrix. Stocky simply searches historical data for occurrences of the current trend pattern and reports how often the following trading day closed higher or lower. The result isn't intended as a predictive model on its own, but as another piece of context that may help.
What Stocky is doing here is looking at the last five years of trading history for the instrument and telling us that the current close trend (Up, Up, Down,Up,Down) has been seen 45 times in the last five years, and when this pattern was seen, 40% of the time the next day was Up and 60% of the time the next day was Down.