Stocky
Stocky is a MacOS native application for fetching and analysis of stock market trading data.
Supports charting, deviations from sliding window averages, and does probabilistic prediction of movement based on trading history.
Market analysis. Native MacOS.
Documentation
Development Updates
October 10, 2026
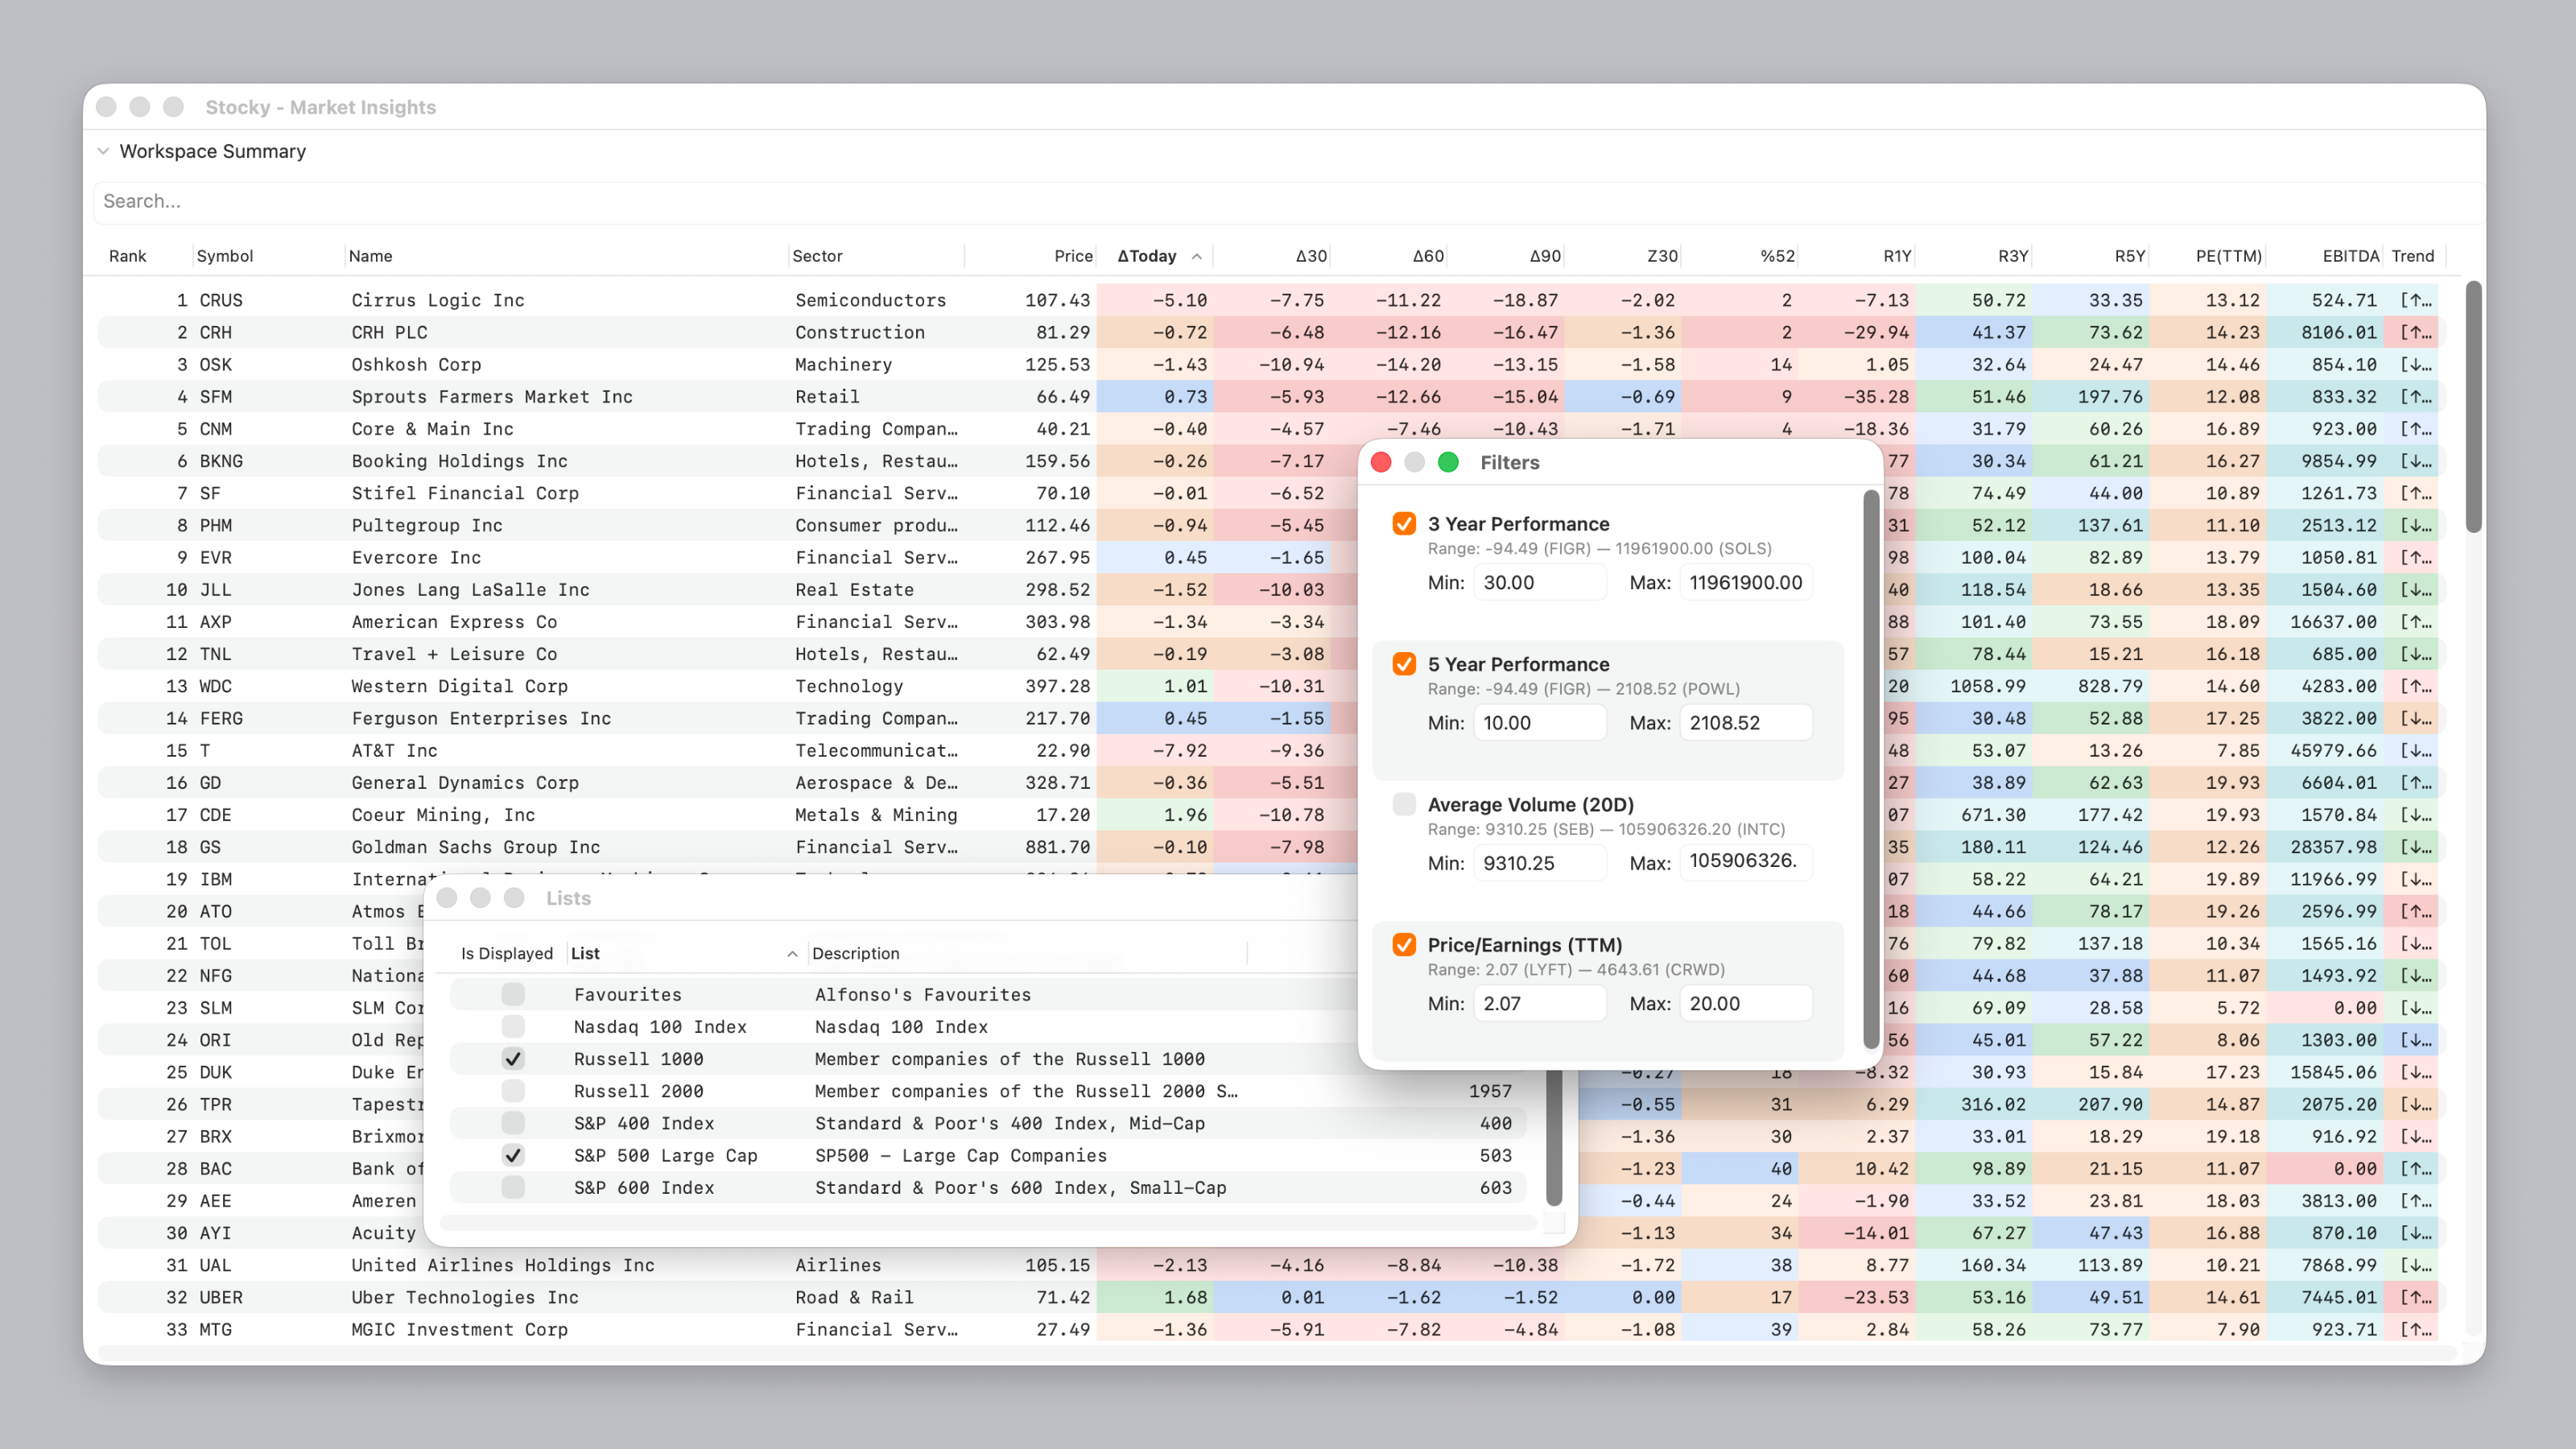
Given the SP500 and Russell 1000, find all Instruments with: A 3 Year return greater than 30. And a 5 Year return greater than 10. And a P/E less than 20. Sorted by loss today.
Done!
Read More →
Graphing
September 18, 2026
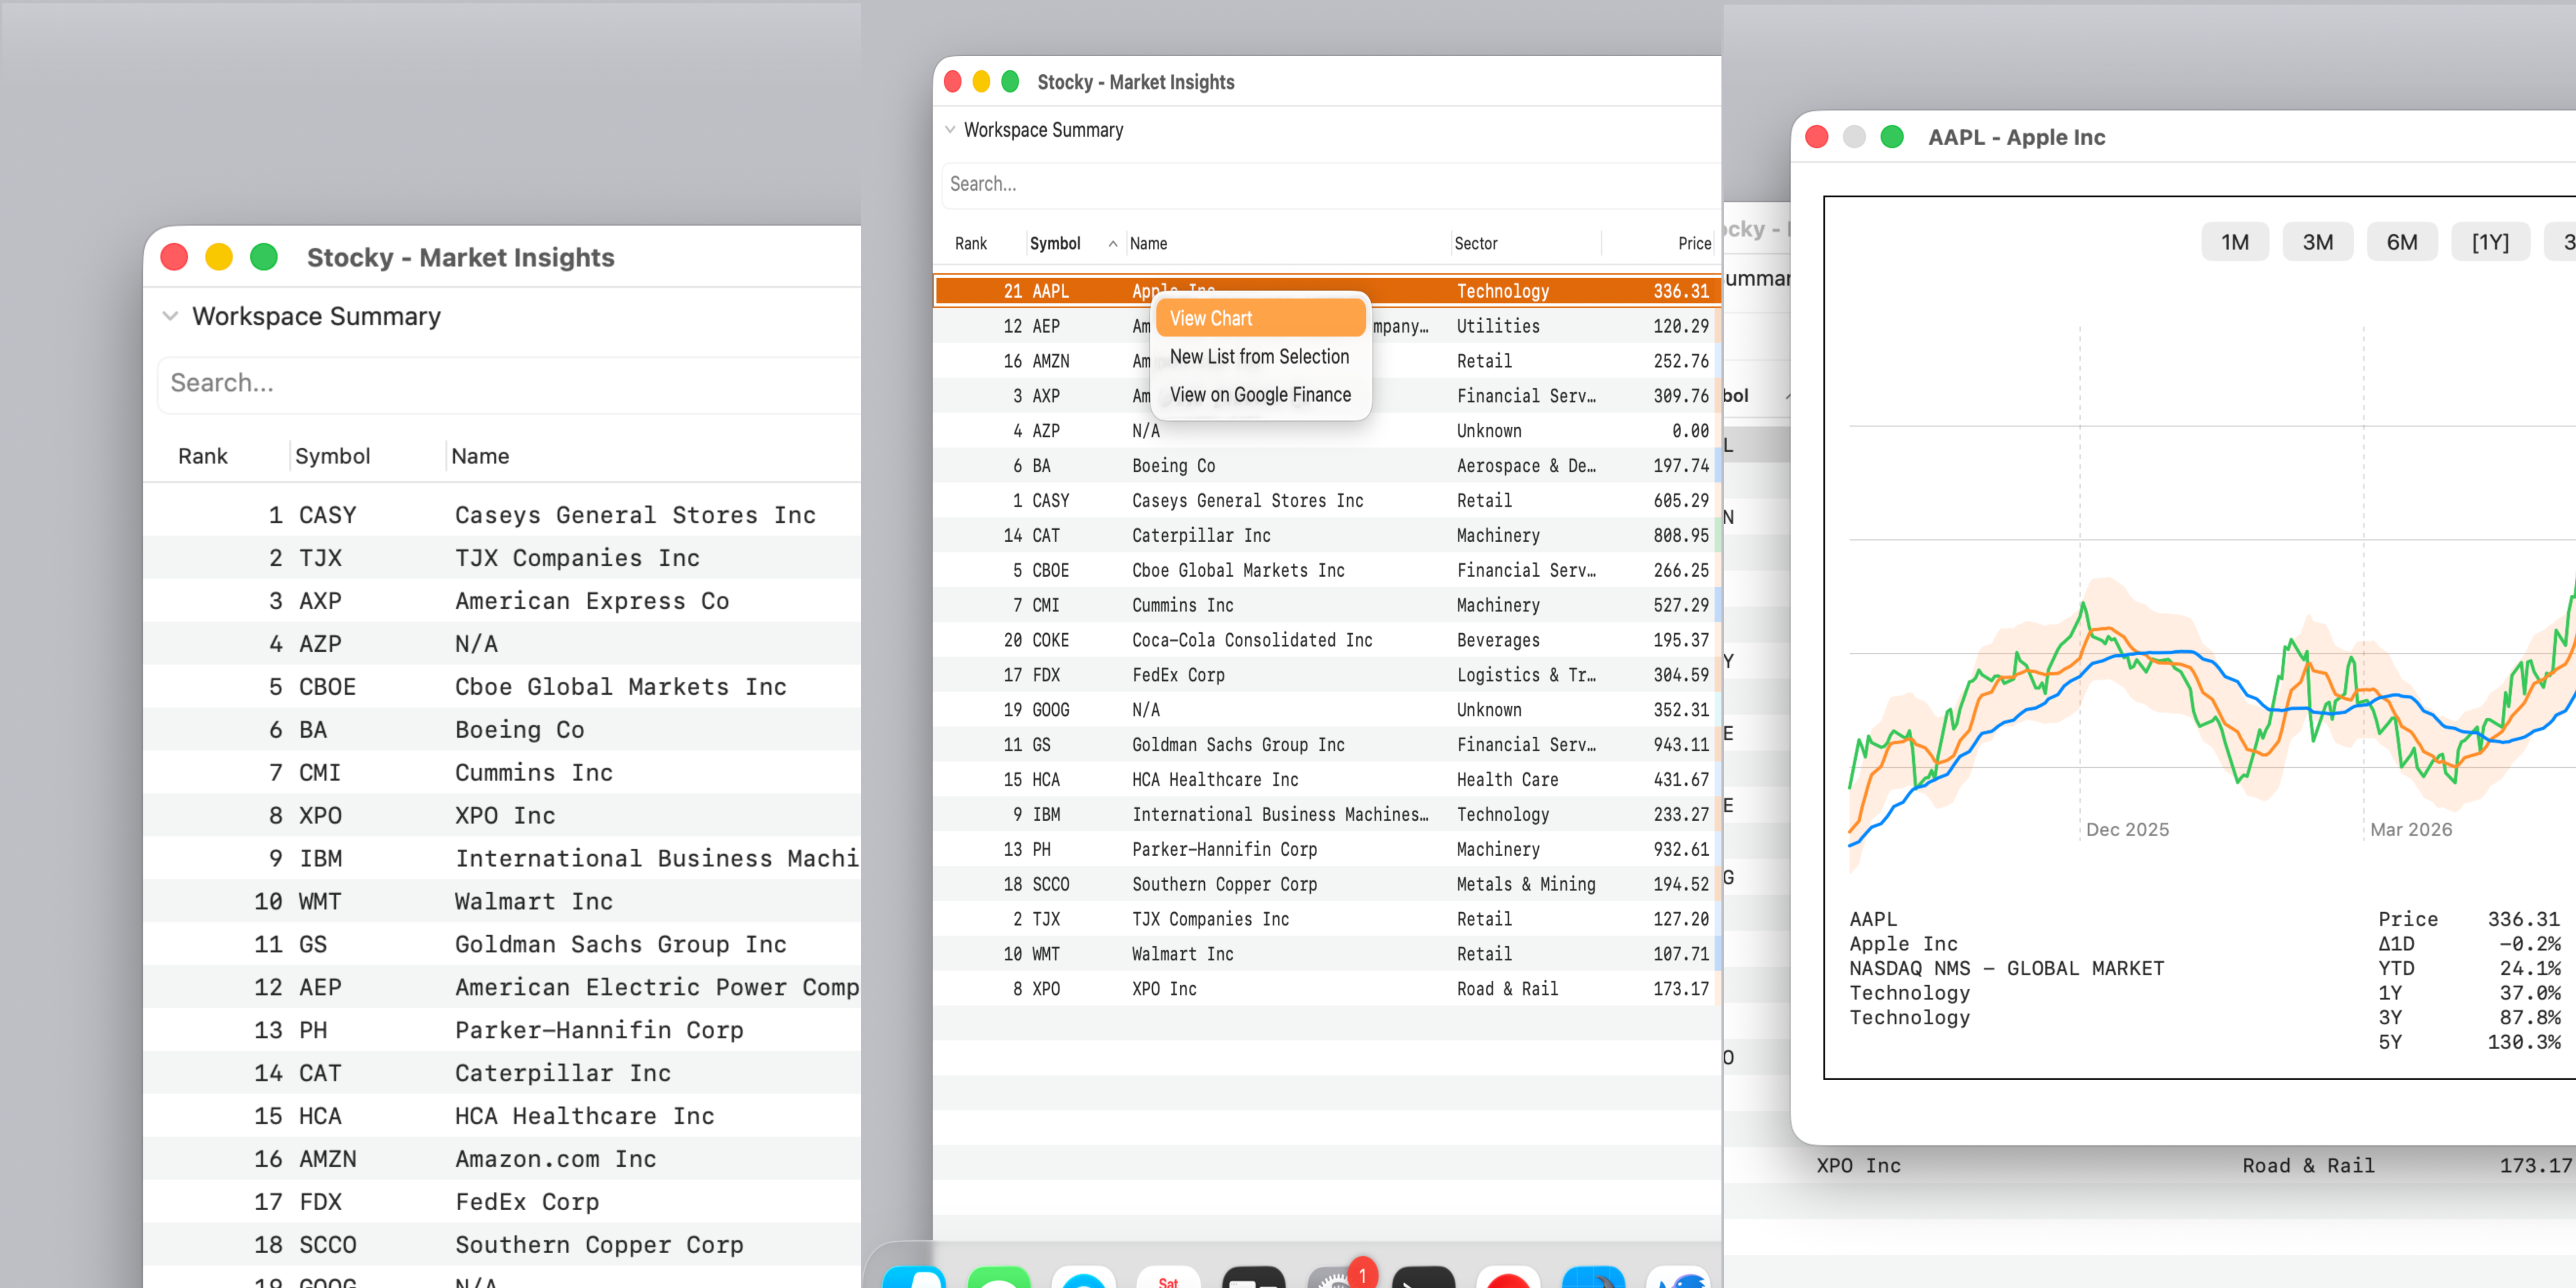
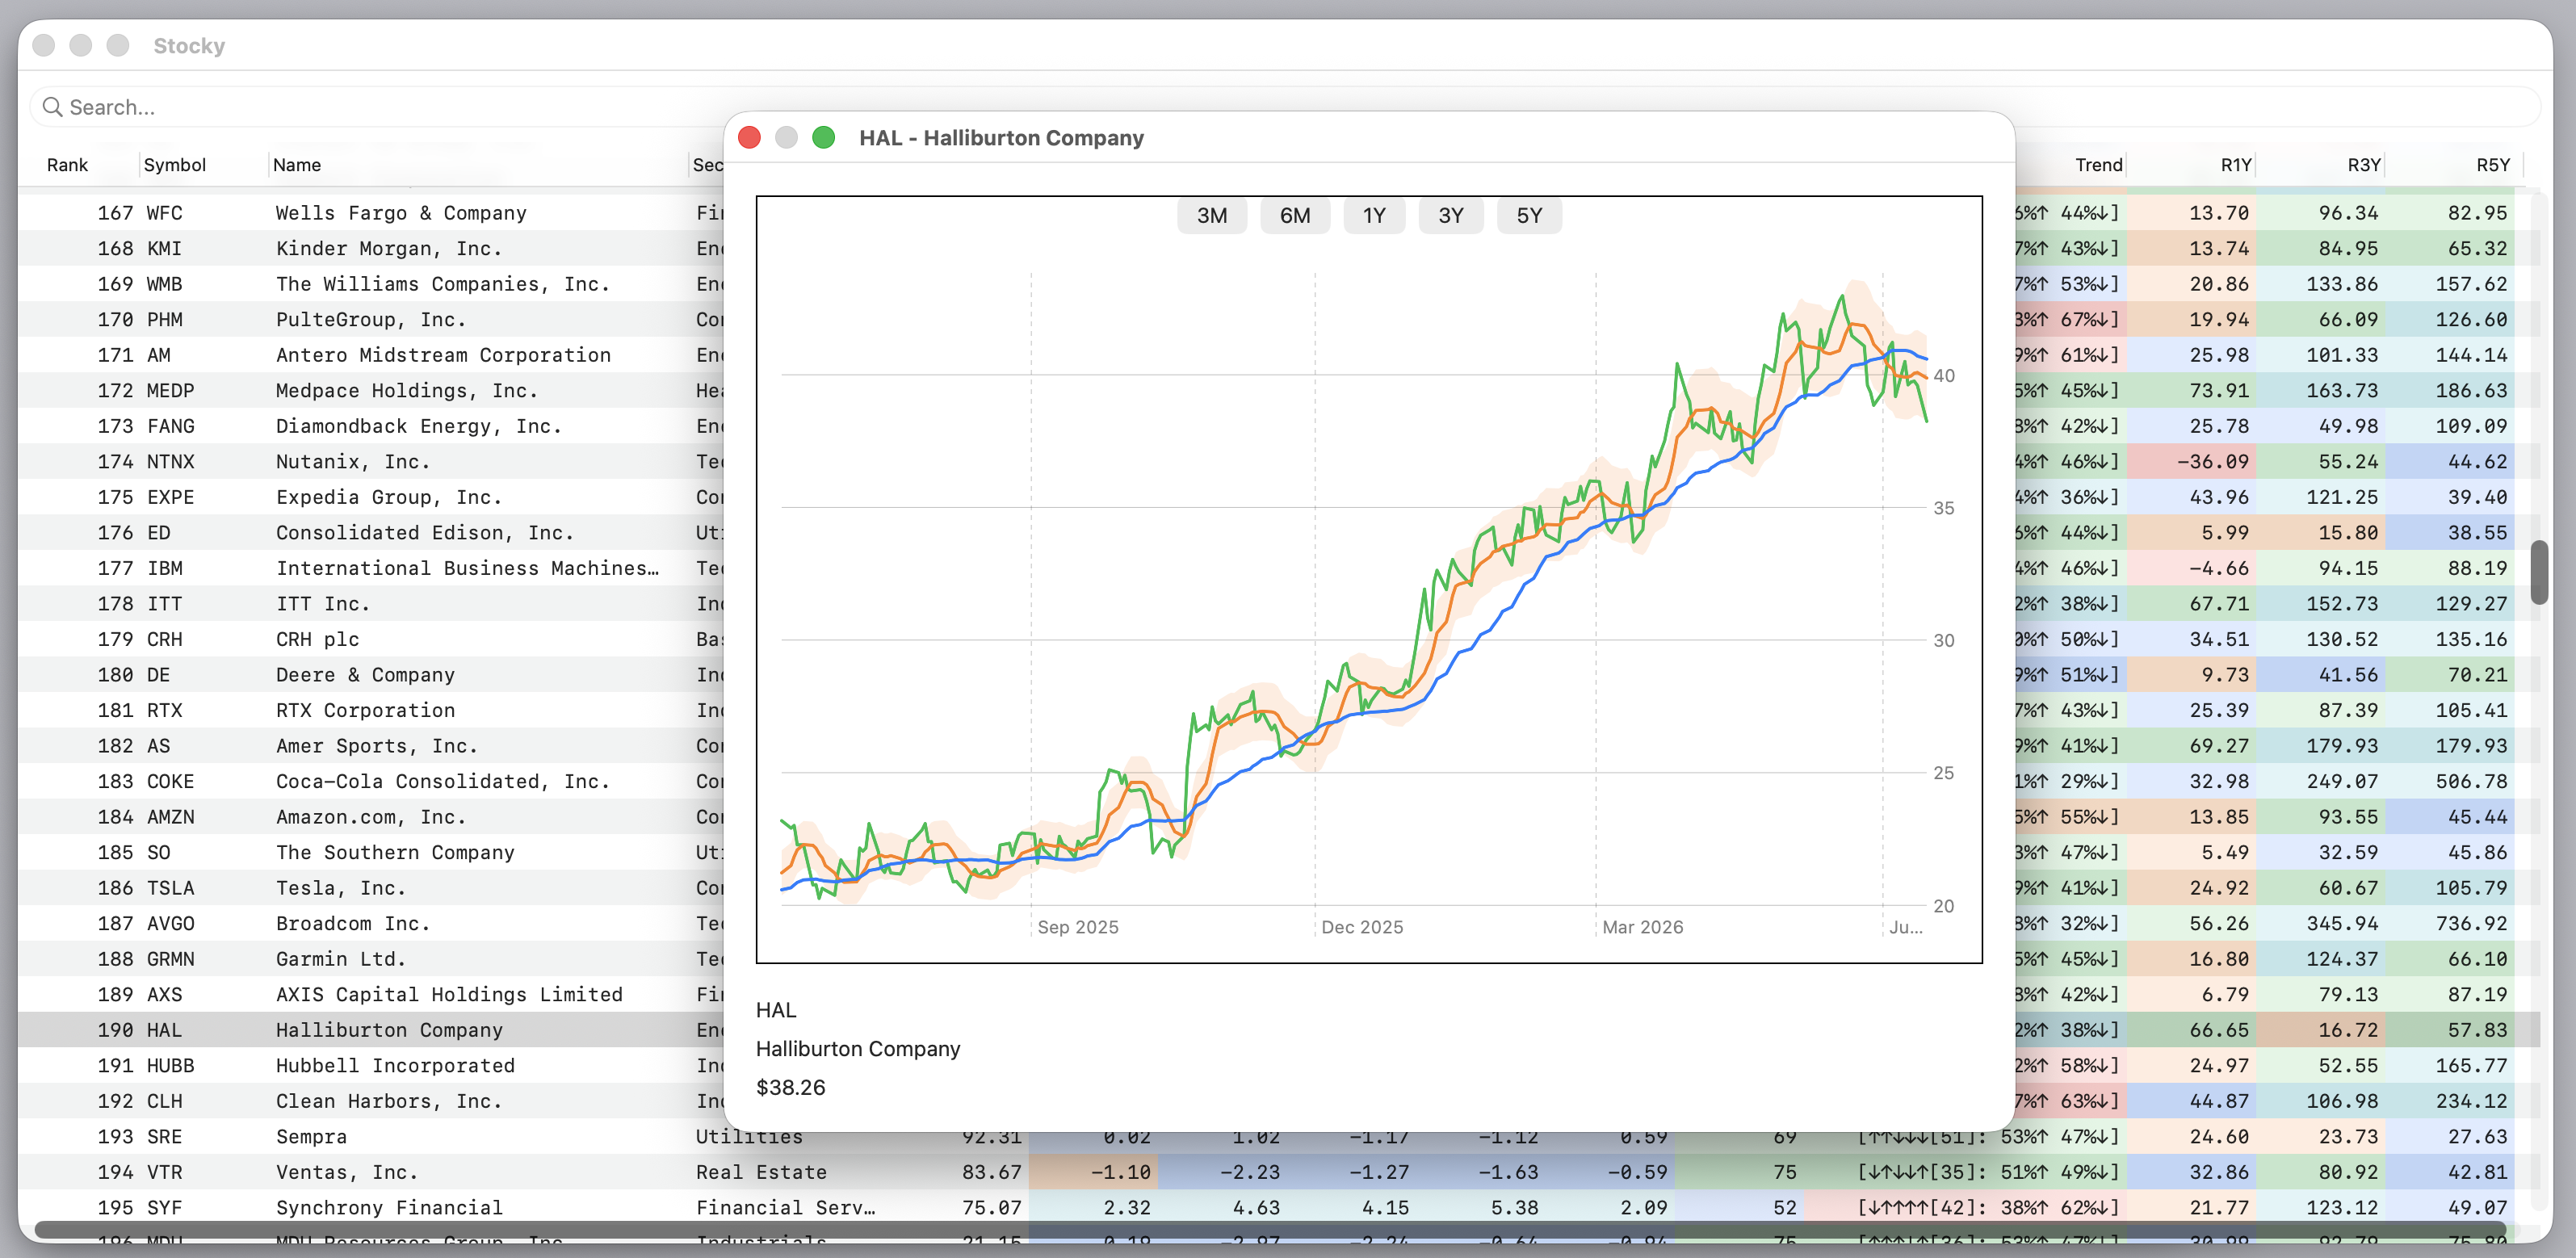
Some detail of the graphing capabilities of Stocky. I deliberately kept the graphing simple because there's better graphing programs out there and that's not what Stocky is meant for. But we do need some graphing functionality, so this view provide
…
Read More →
PE & EBITDA
September 14, 2026
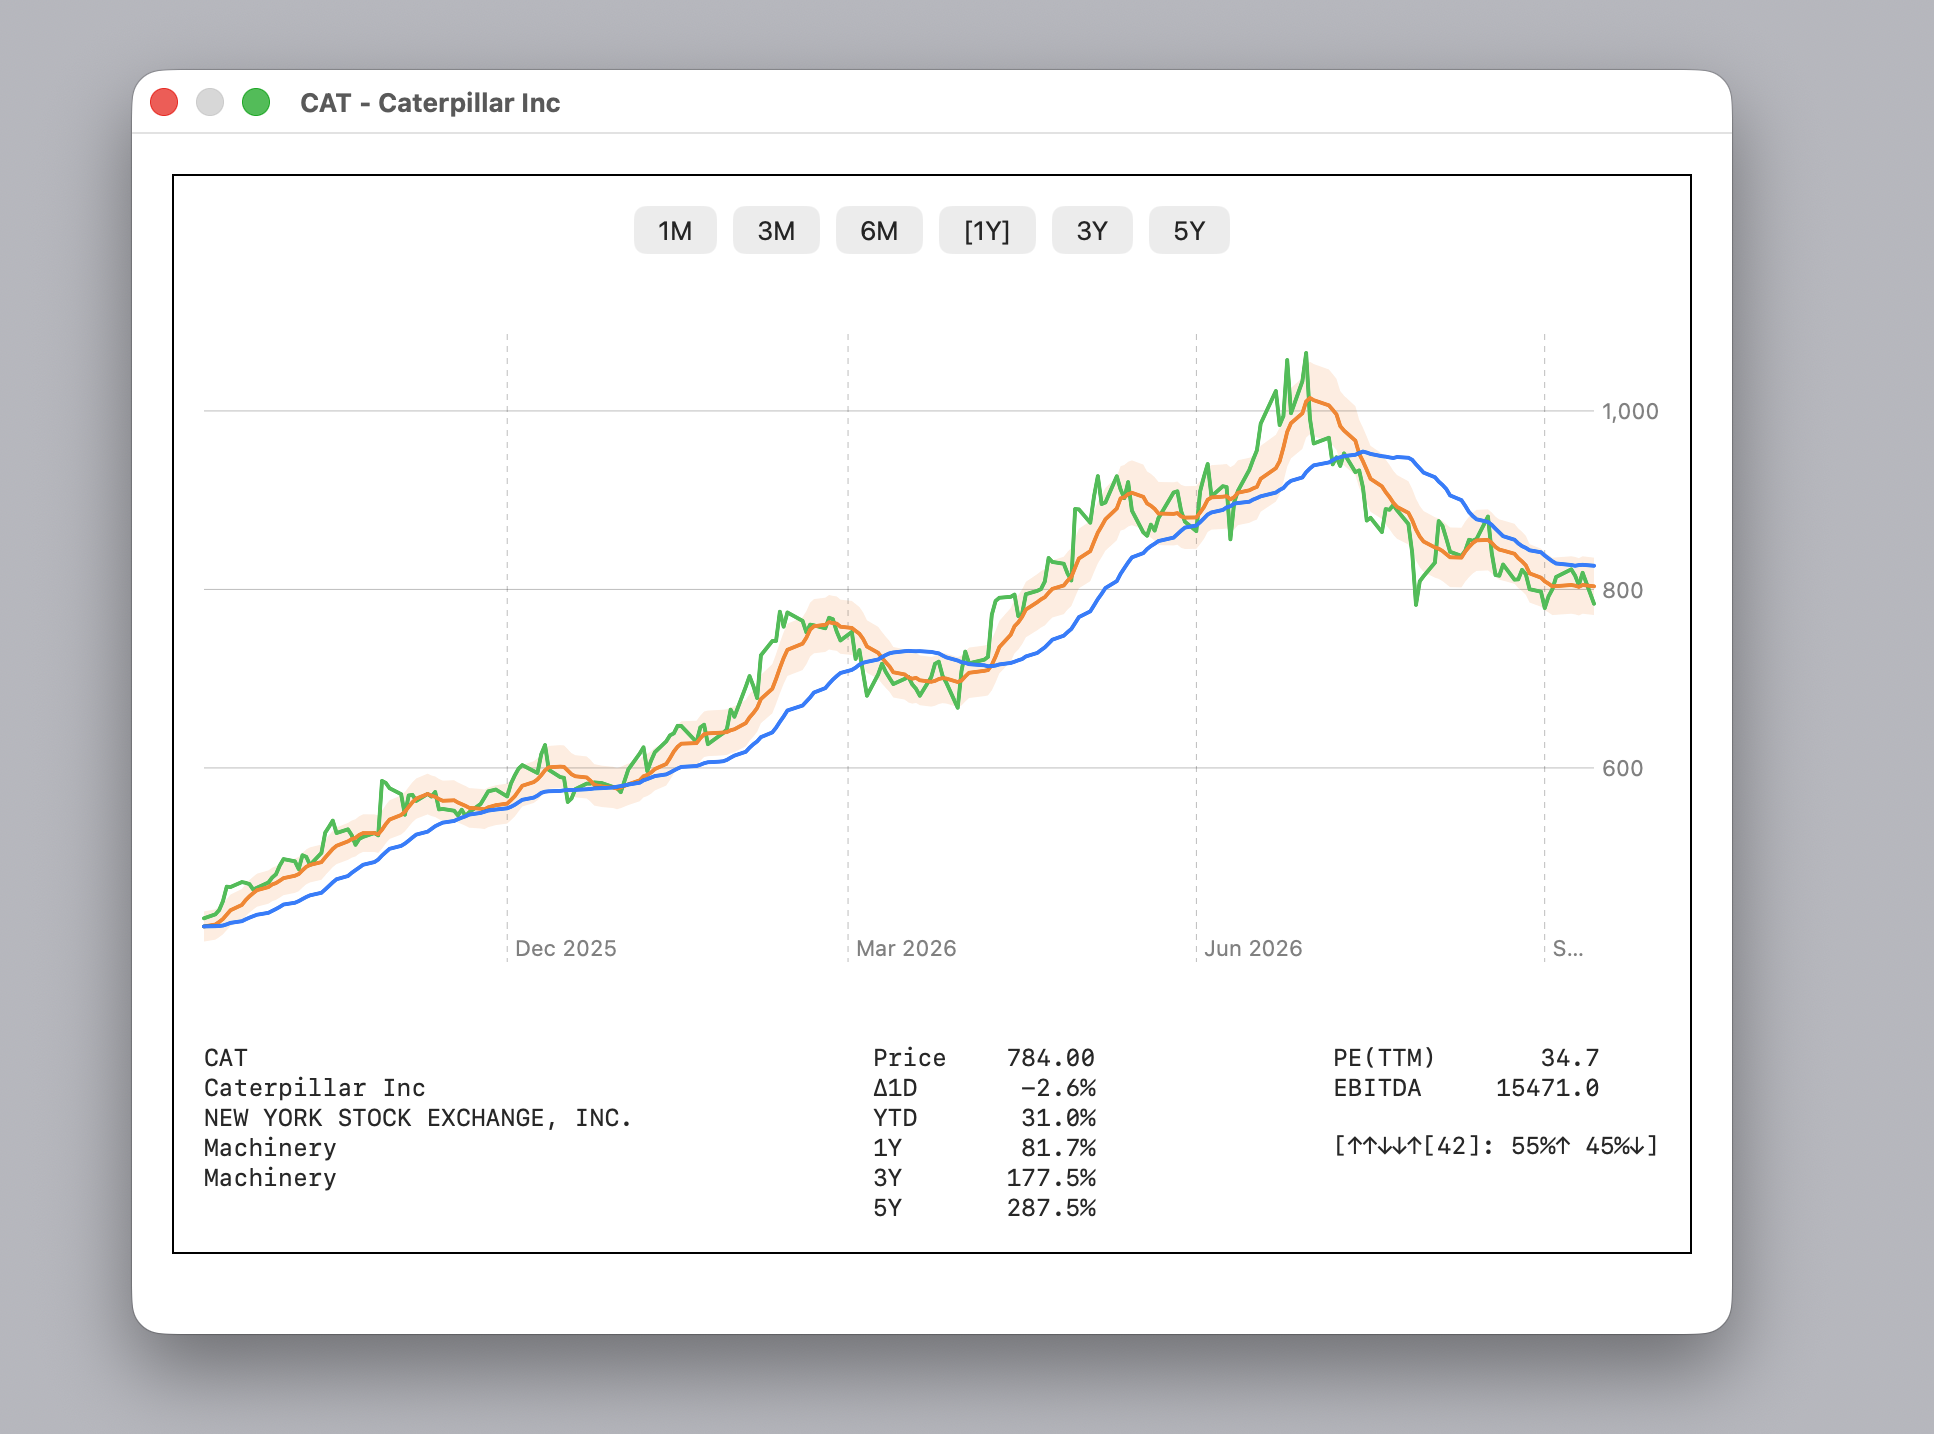
Stocky - Market Insights now provides PE and EBITDA information allowing for more informed decision making when trying to find viable investments in a crowded market.
PE measures the company's current share price vs. earnings, and EBITDA is earnings
…
Read More →
Waiting for Review

August 22, 2026
Submitted for review. Now for the first of many rejections, the Apple review team is great at finding all the is I didn't dot and the ts I didn't cross.
Read More →
Icon
August 22, 2026
Because Orange is the best colour.
Read More →
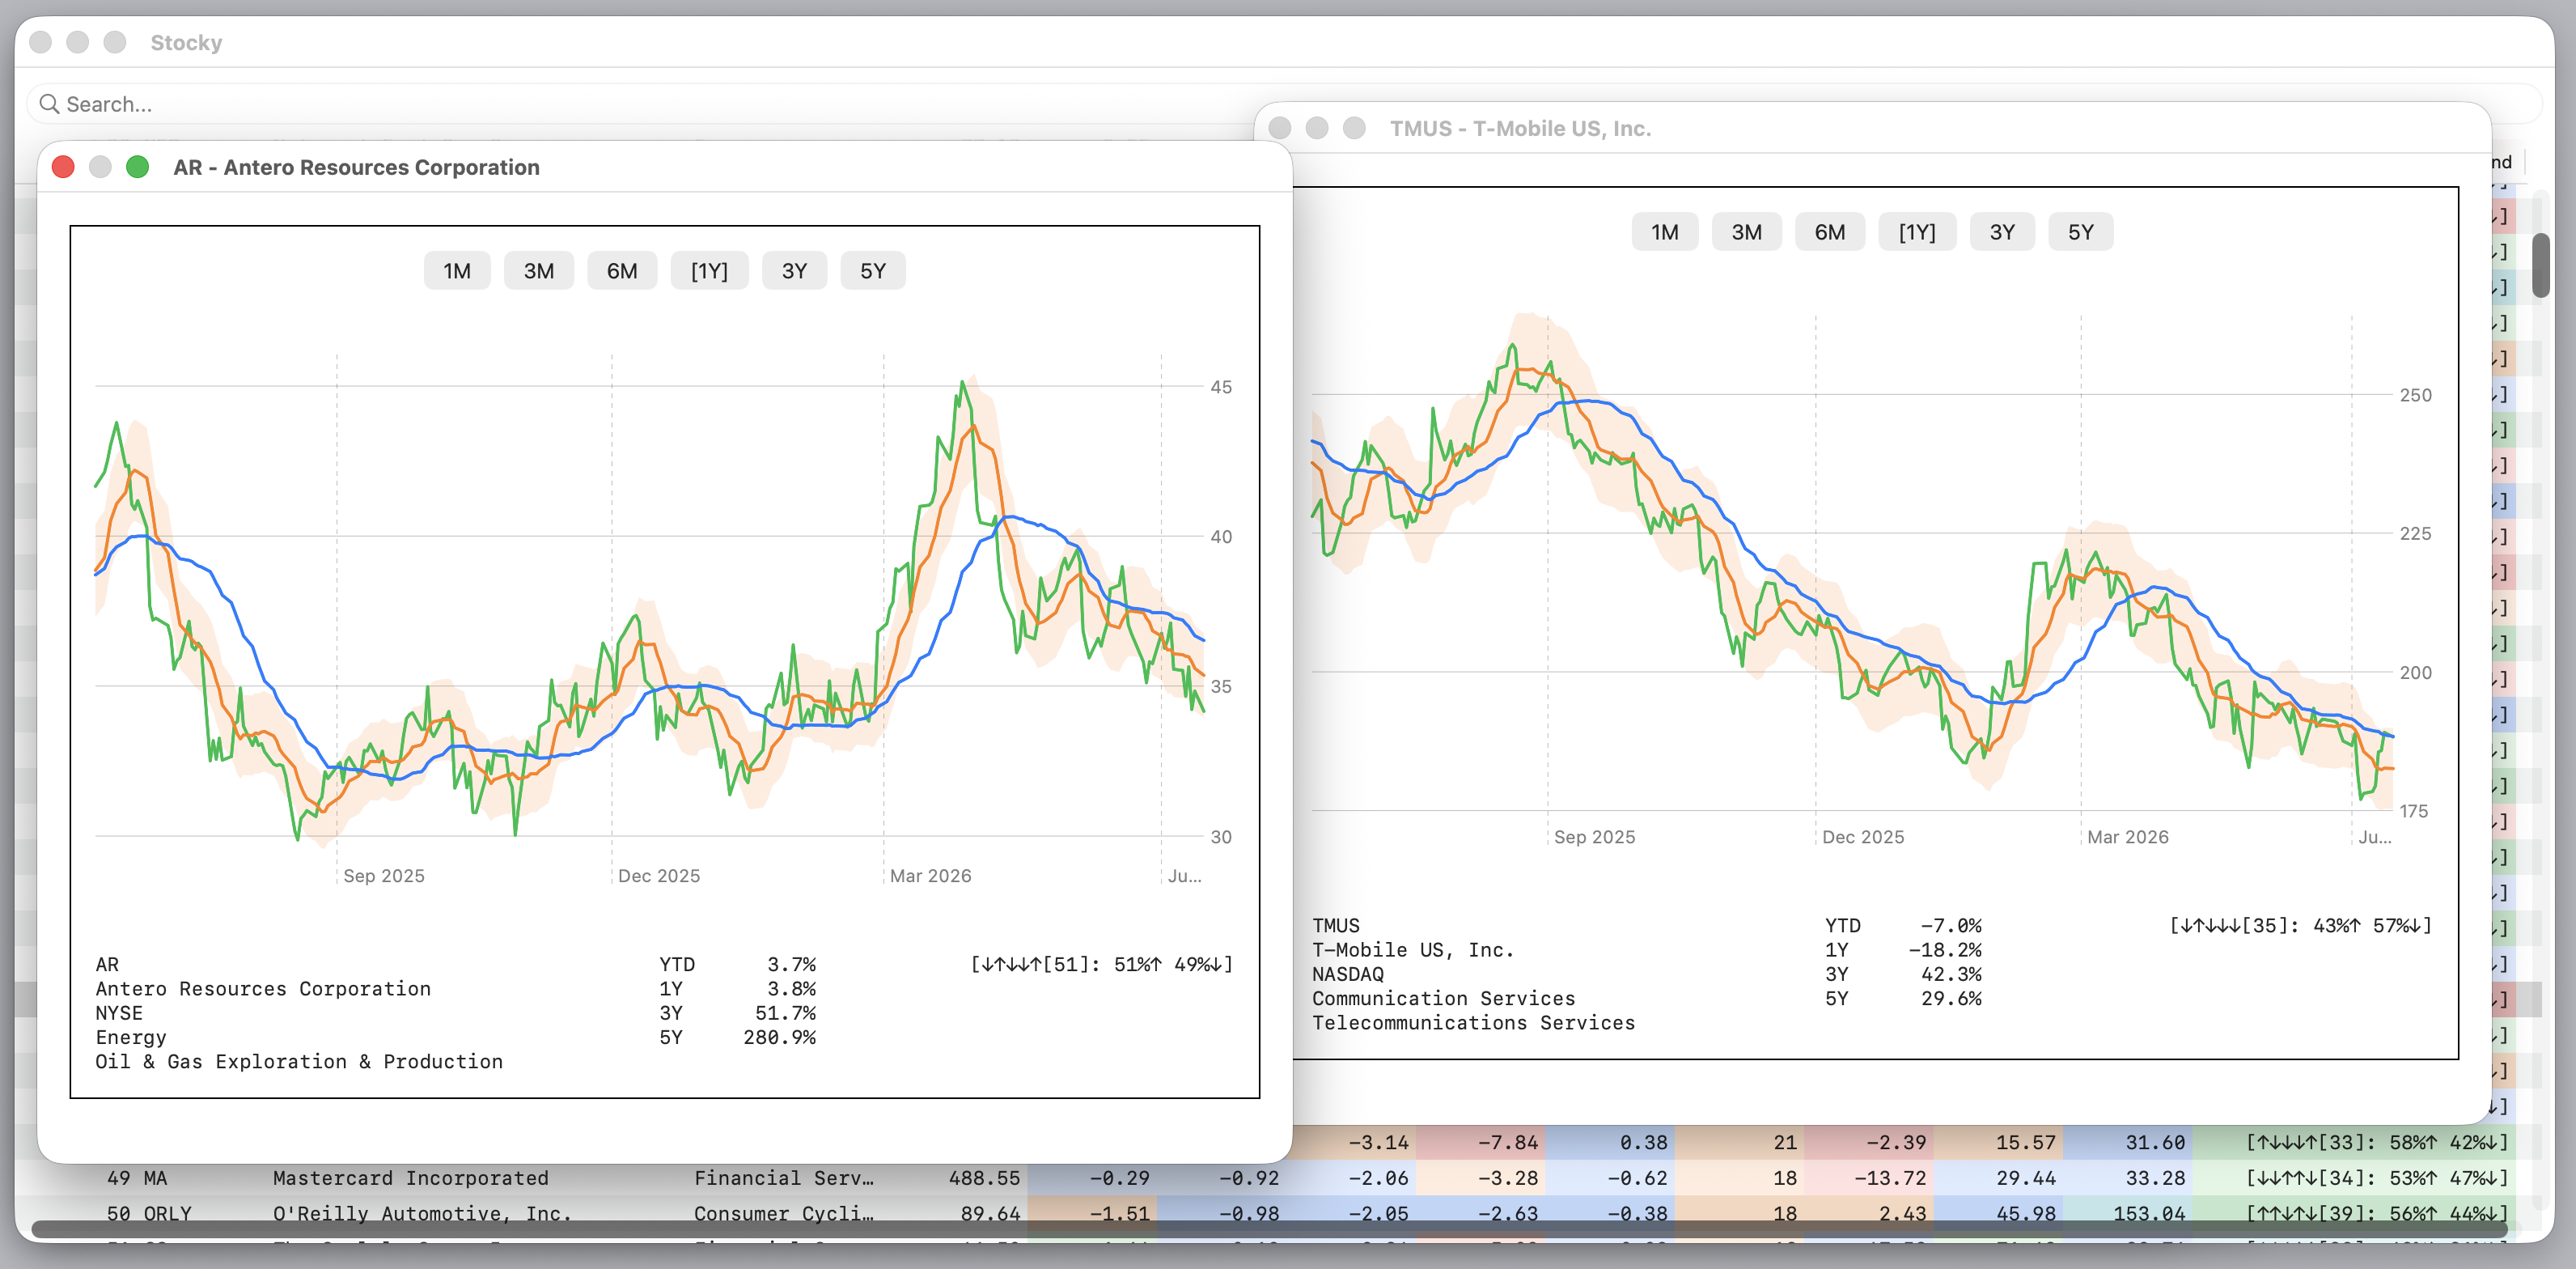
Multiple Graphs
June 9, 2026
Added the ability to render multiple graphs for comparison between instruments.
Read More →
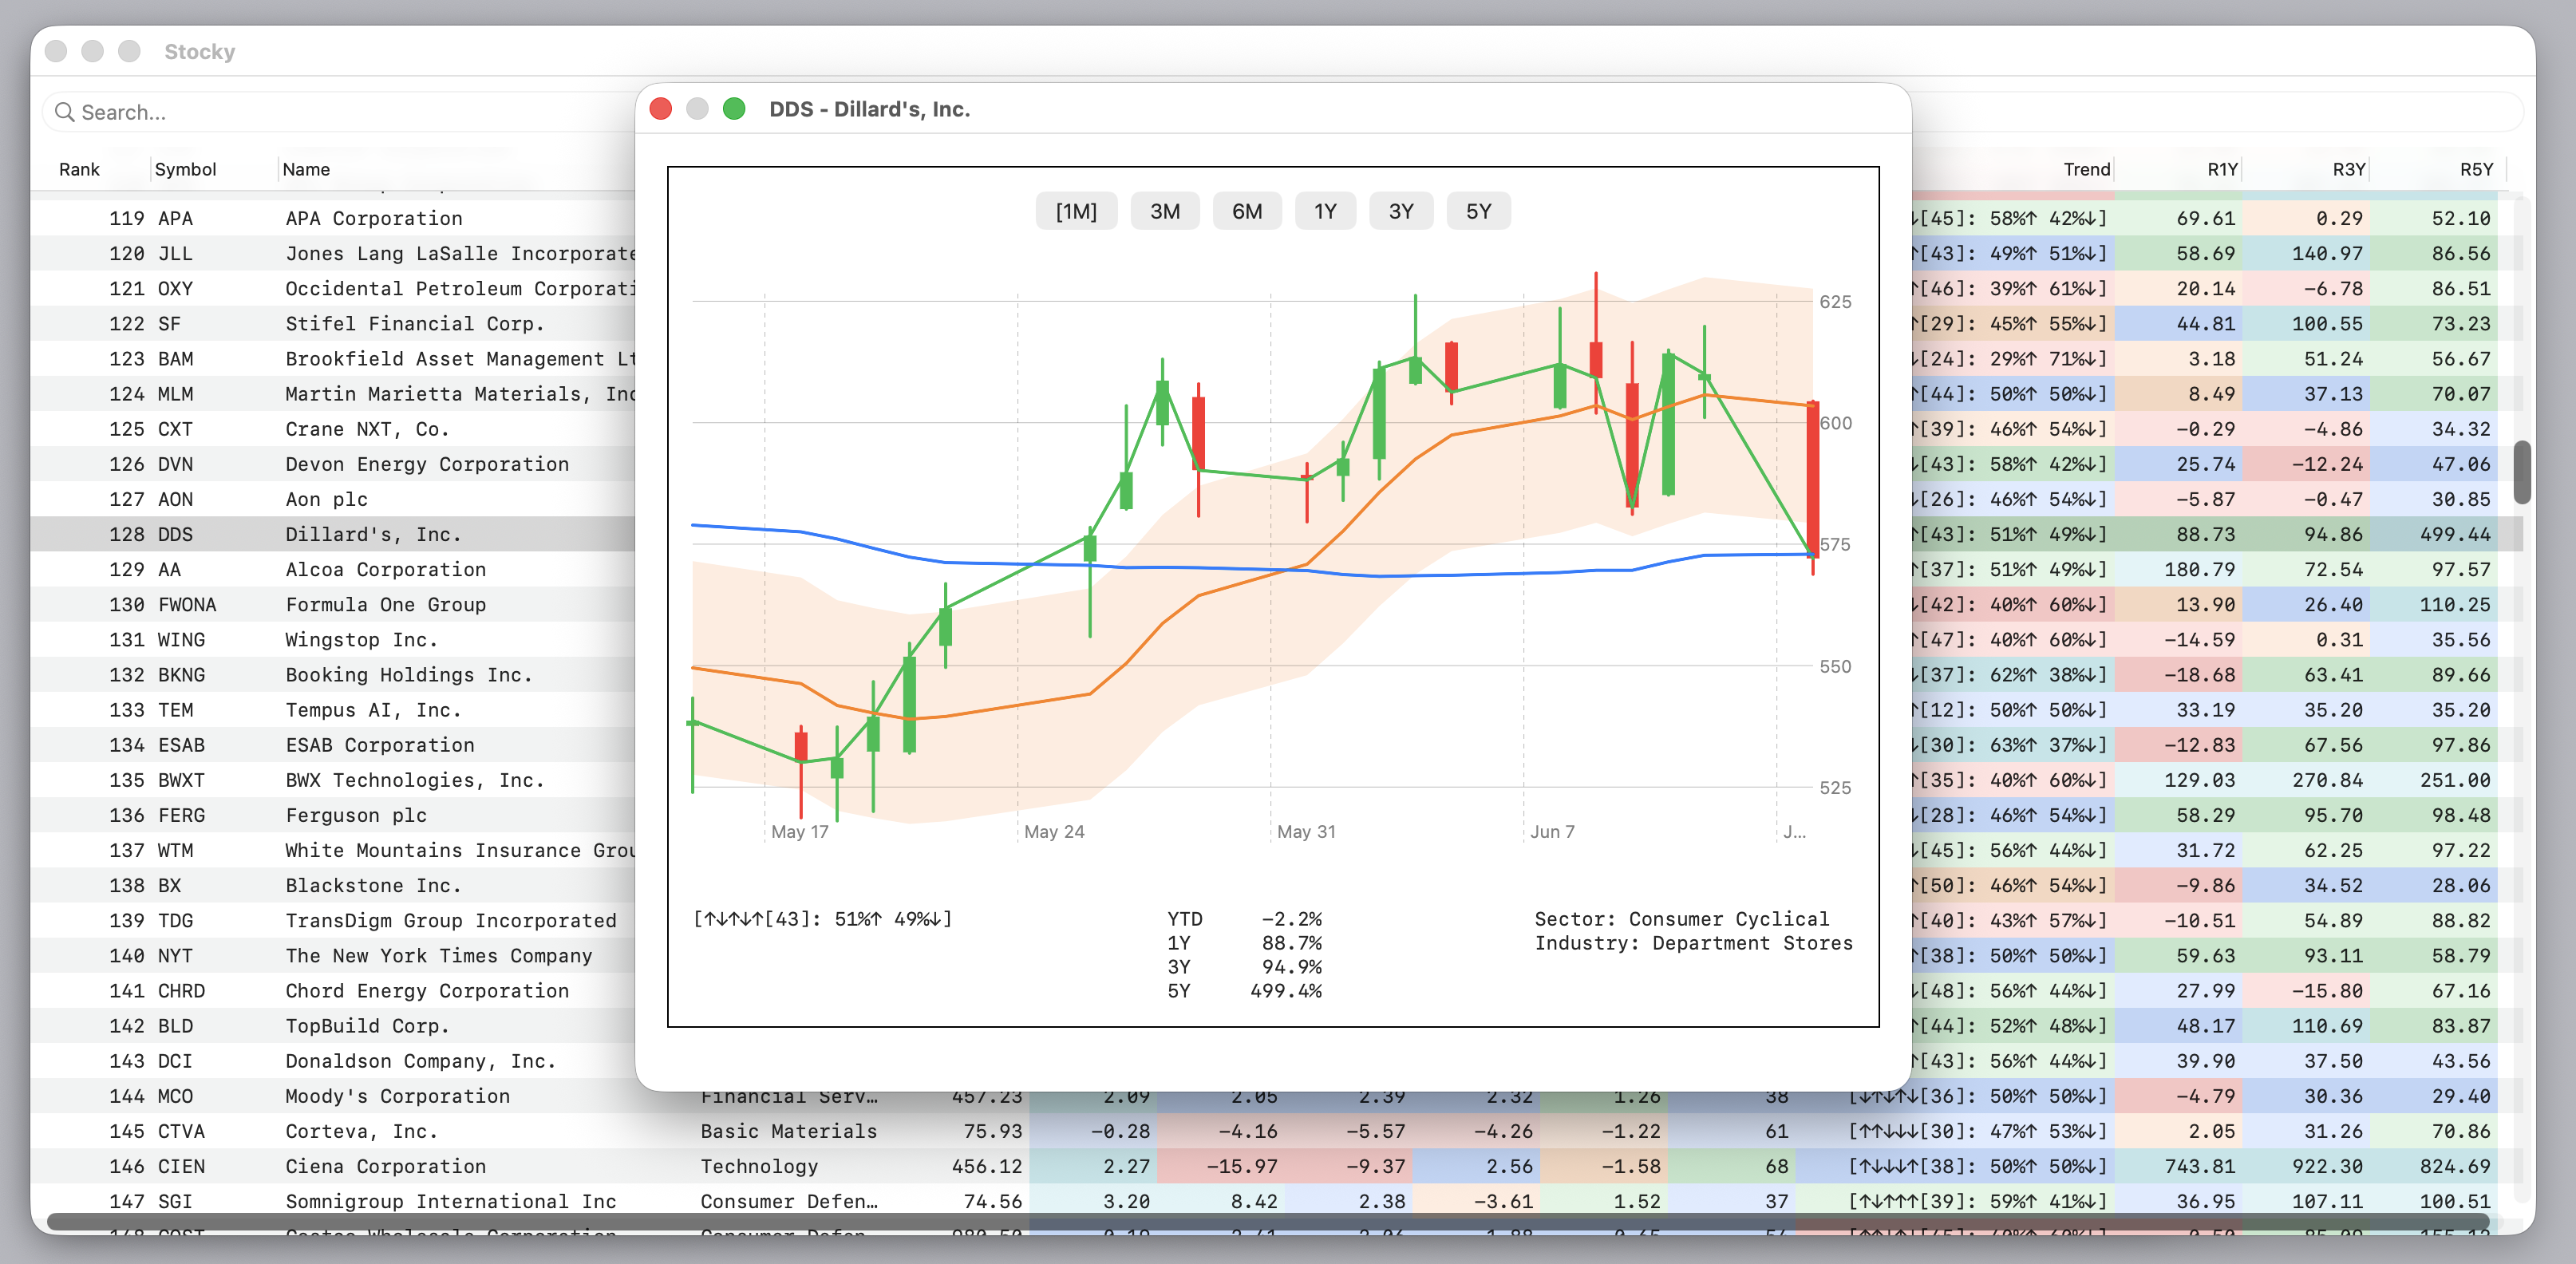
Candlesticks
June 1, 2026
We now have candlesticks rendering on the 1M graph view.
Read More →
Charting
System Theme
May 29, 2026
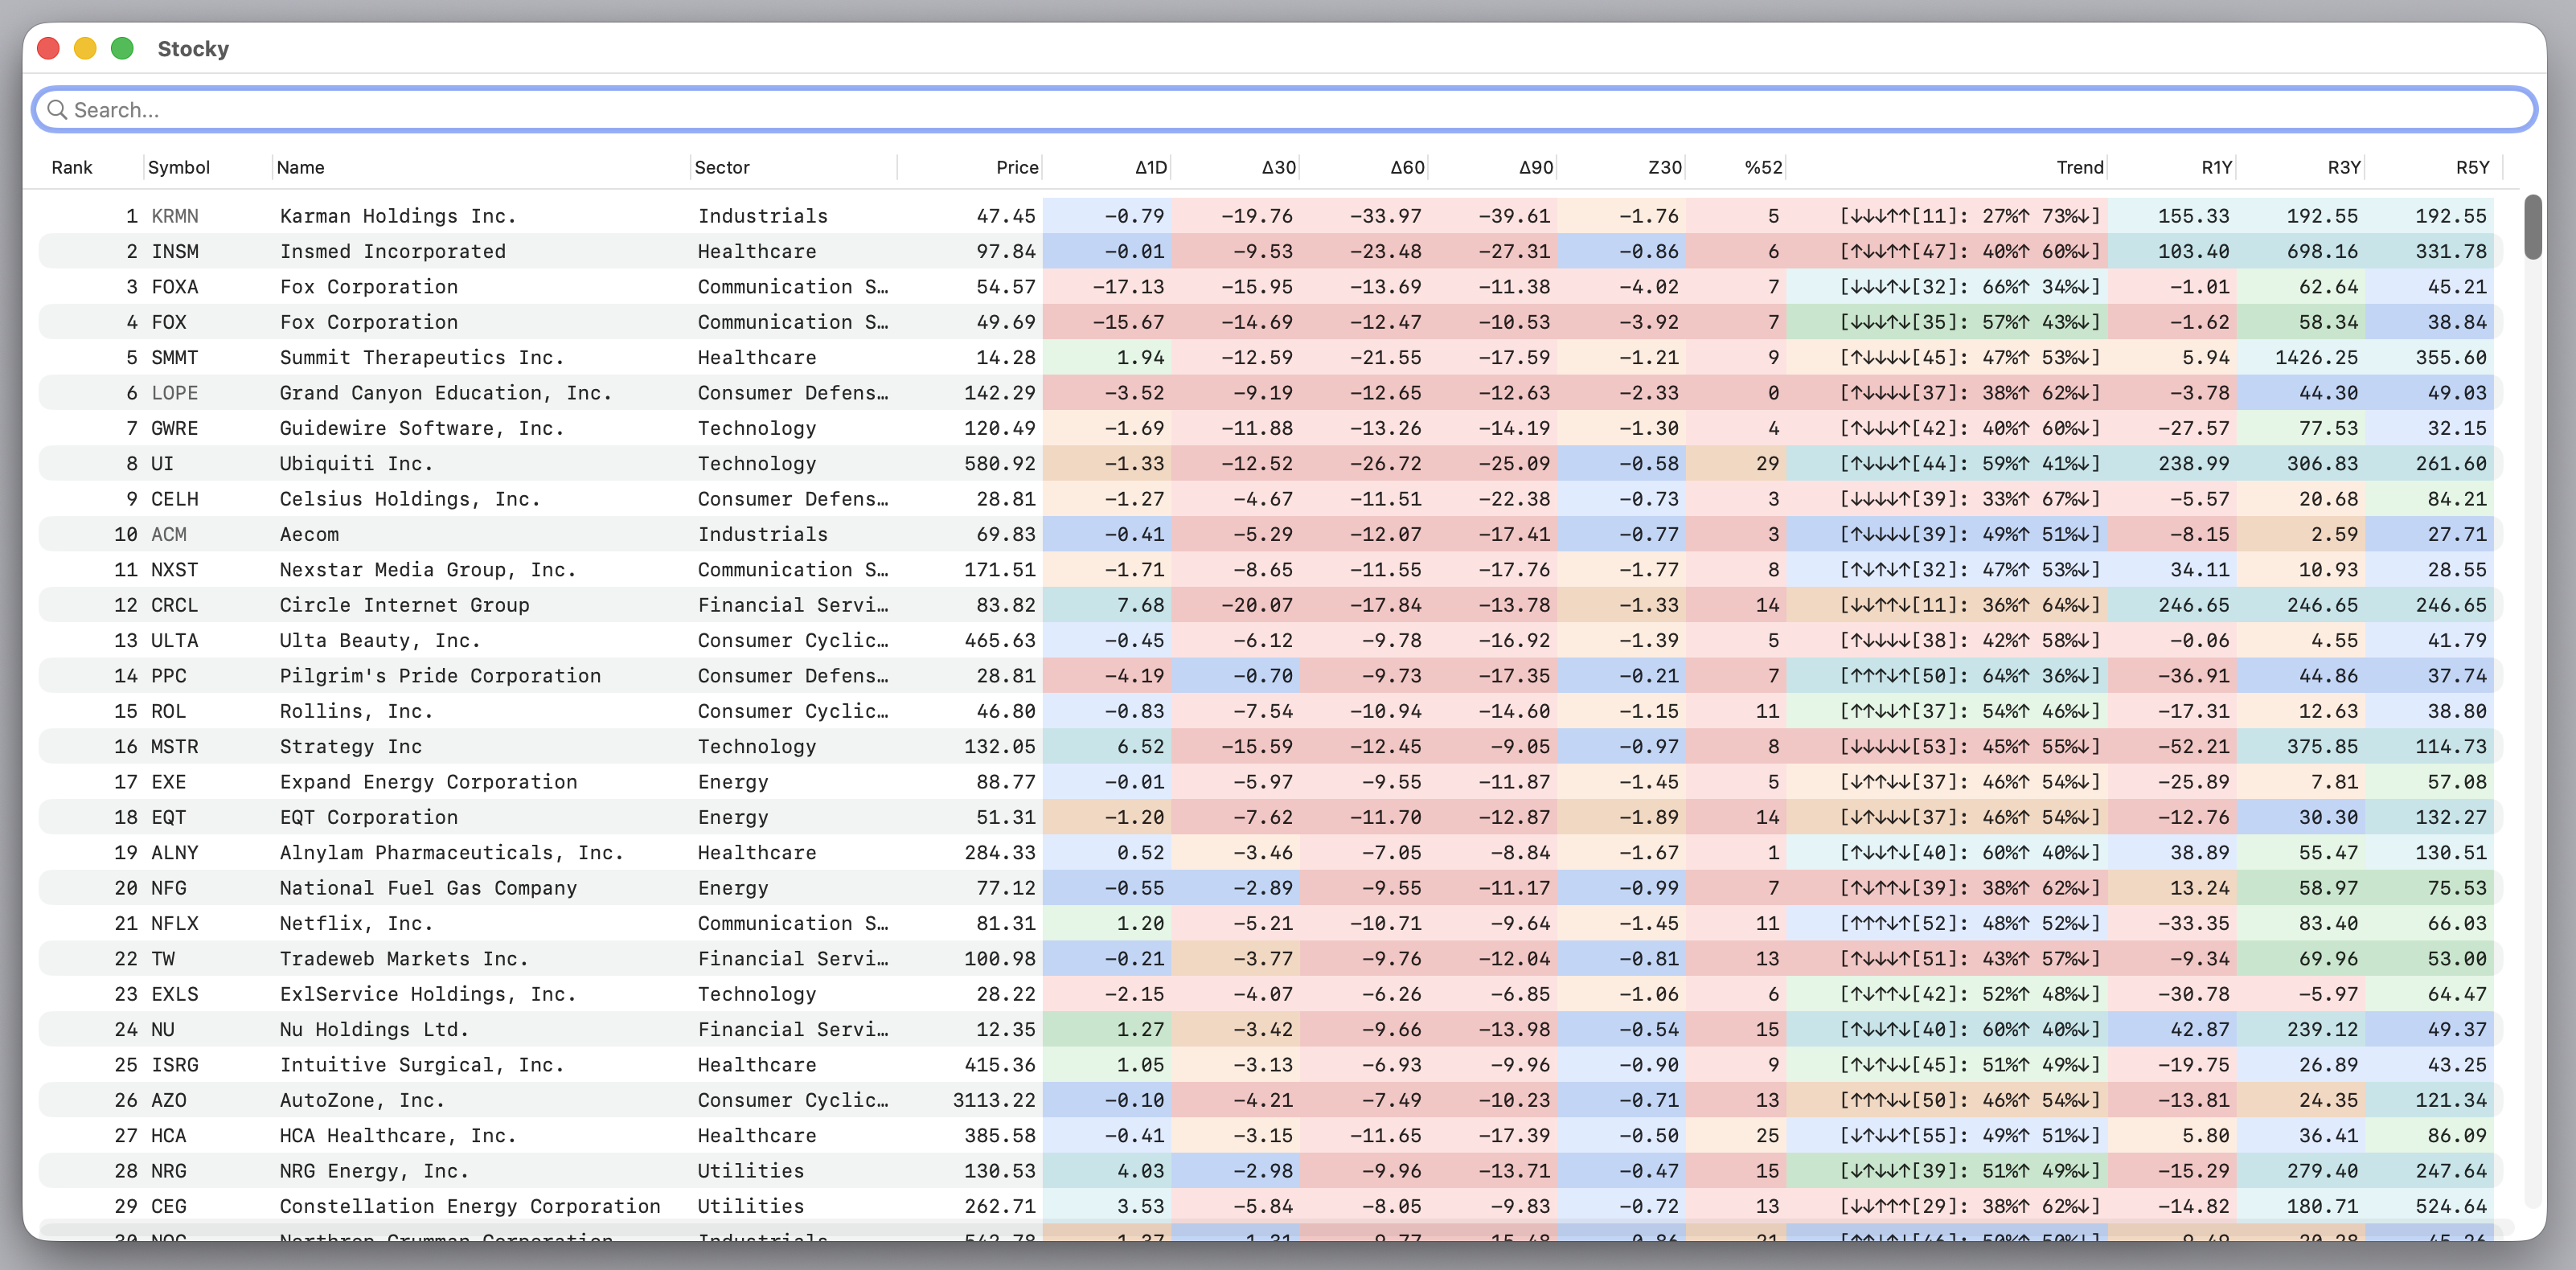
So I ran into a bunch of difficulty styling the table and search box dark and I didn't want to invest any more time into it as I had other features I wanted to get done first, so I ended up implementing a System theme, using MacOS defined colours.
No
…
Read More →
Gruvbox Dark
May 25, 2026
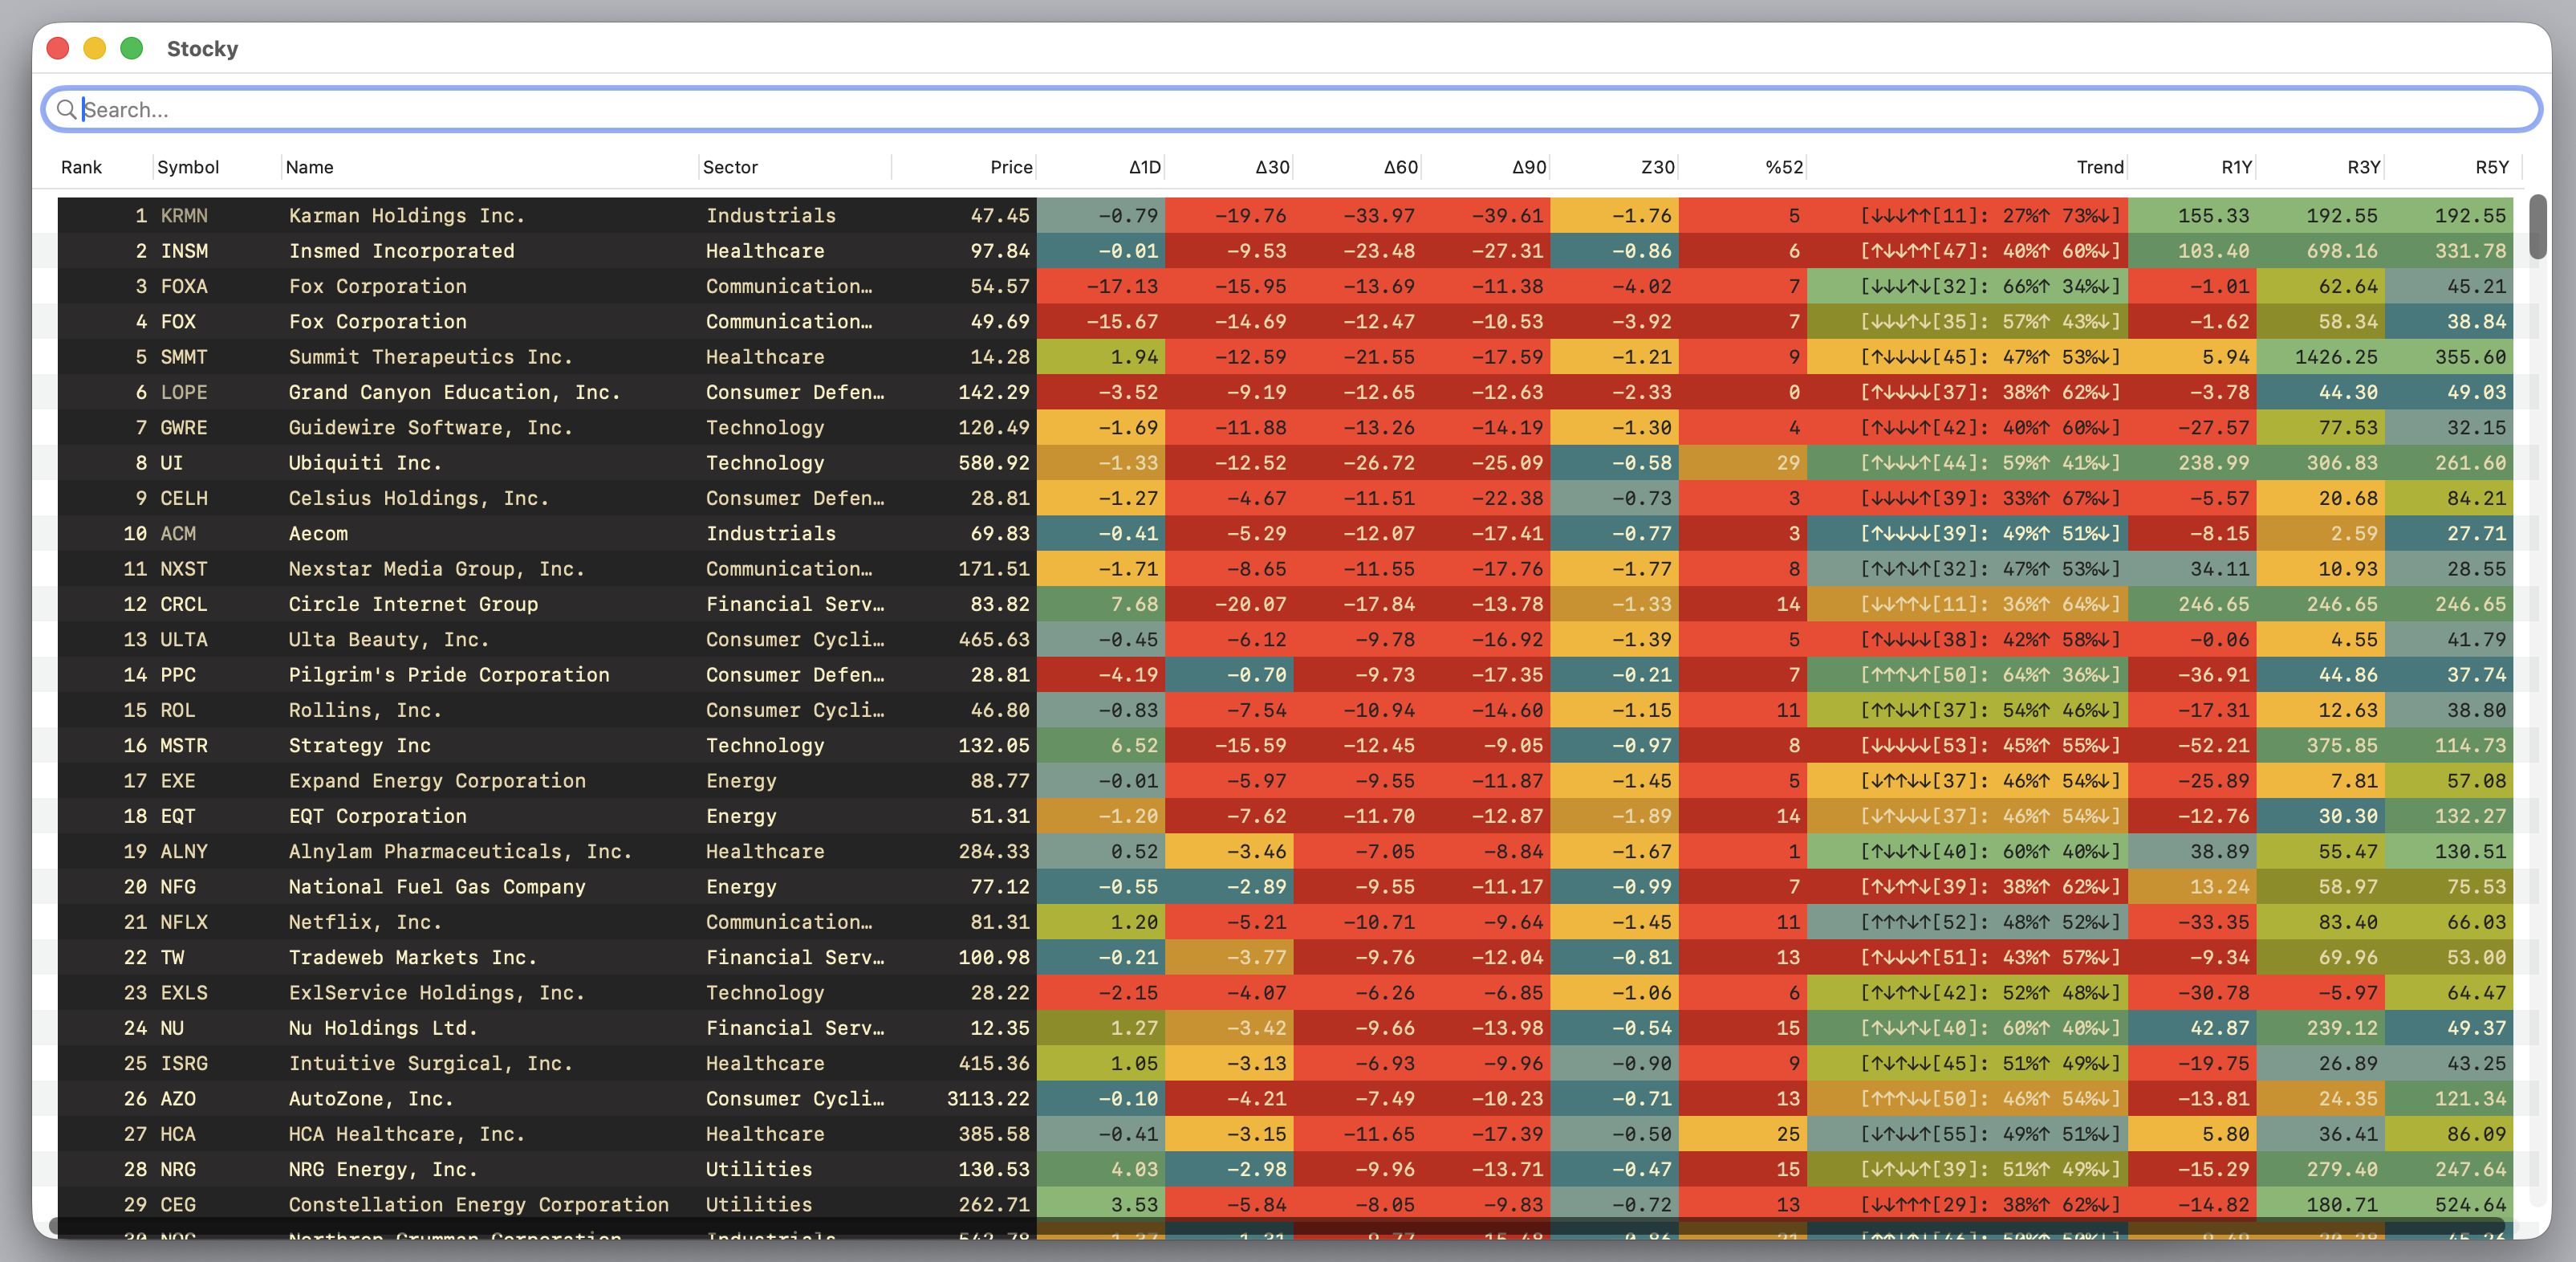
First pass at creating custom themes, started with an implementation of Gruvbox Dark, which is my favourite for editing / terminal sessions.
Read More →
Export to CSV
May 21, 2026
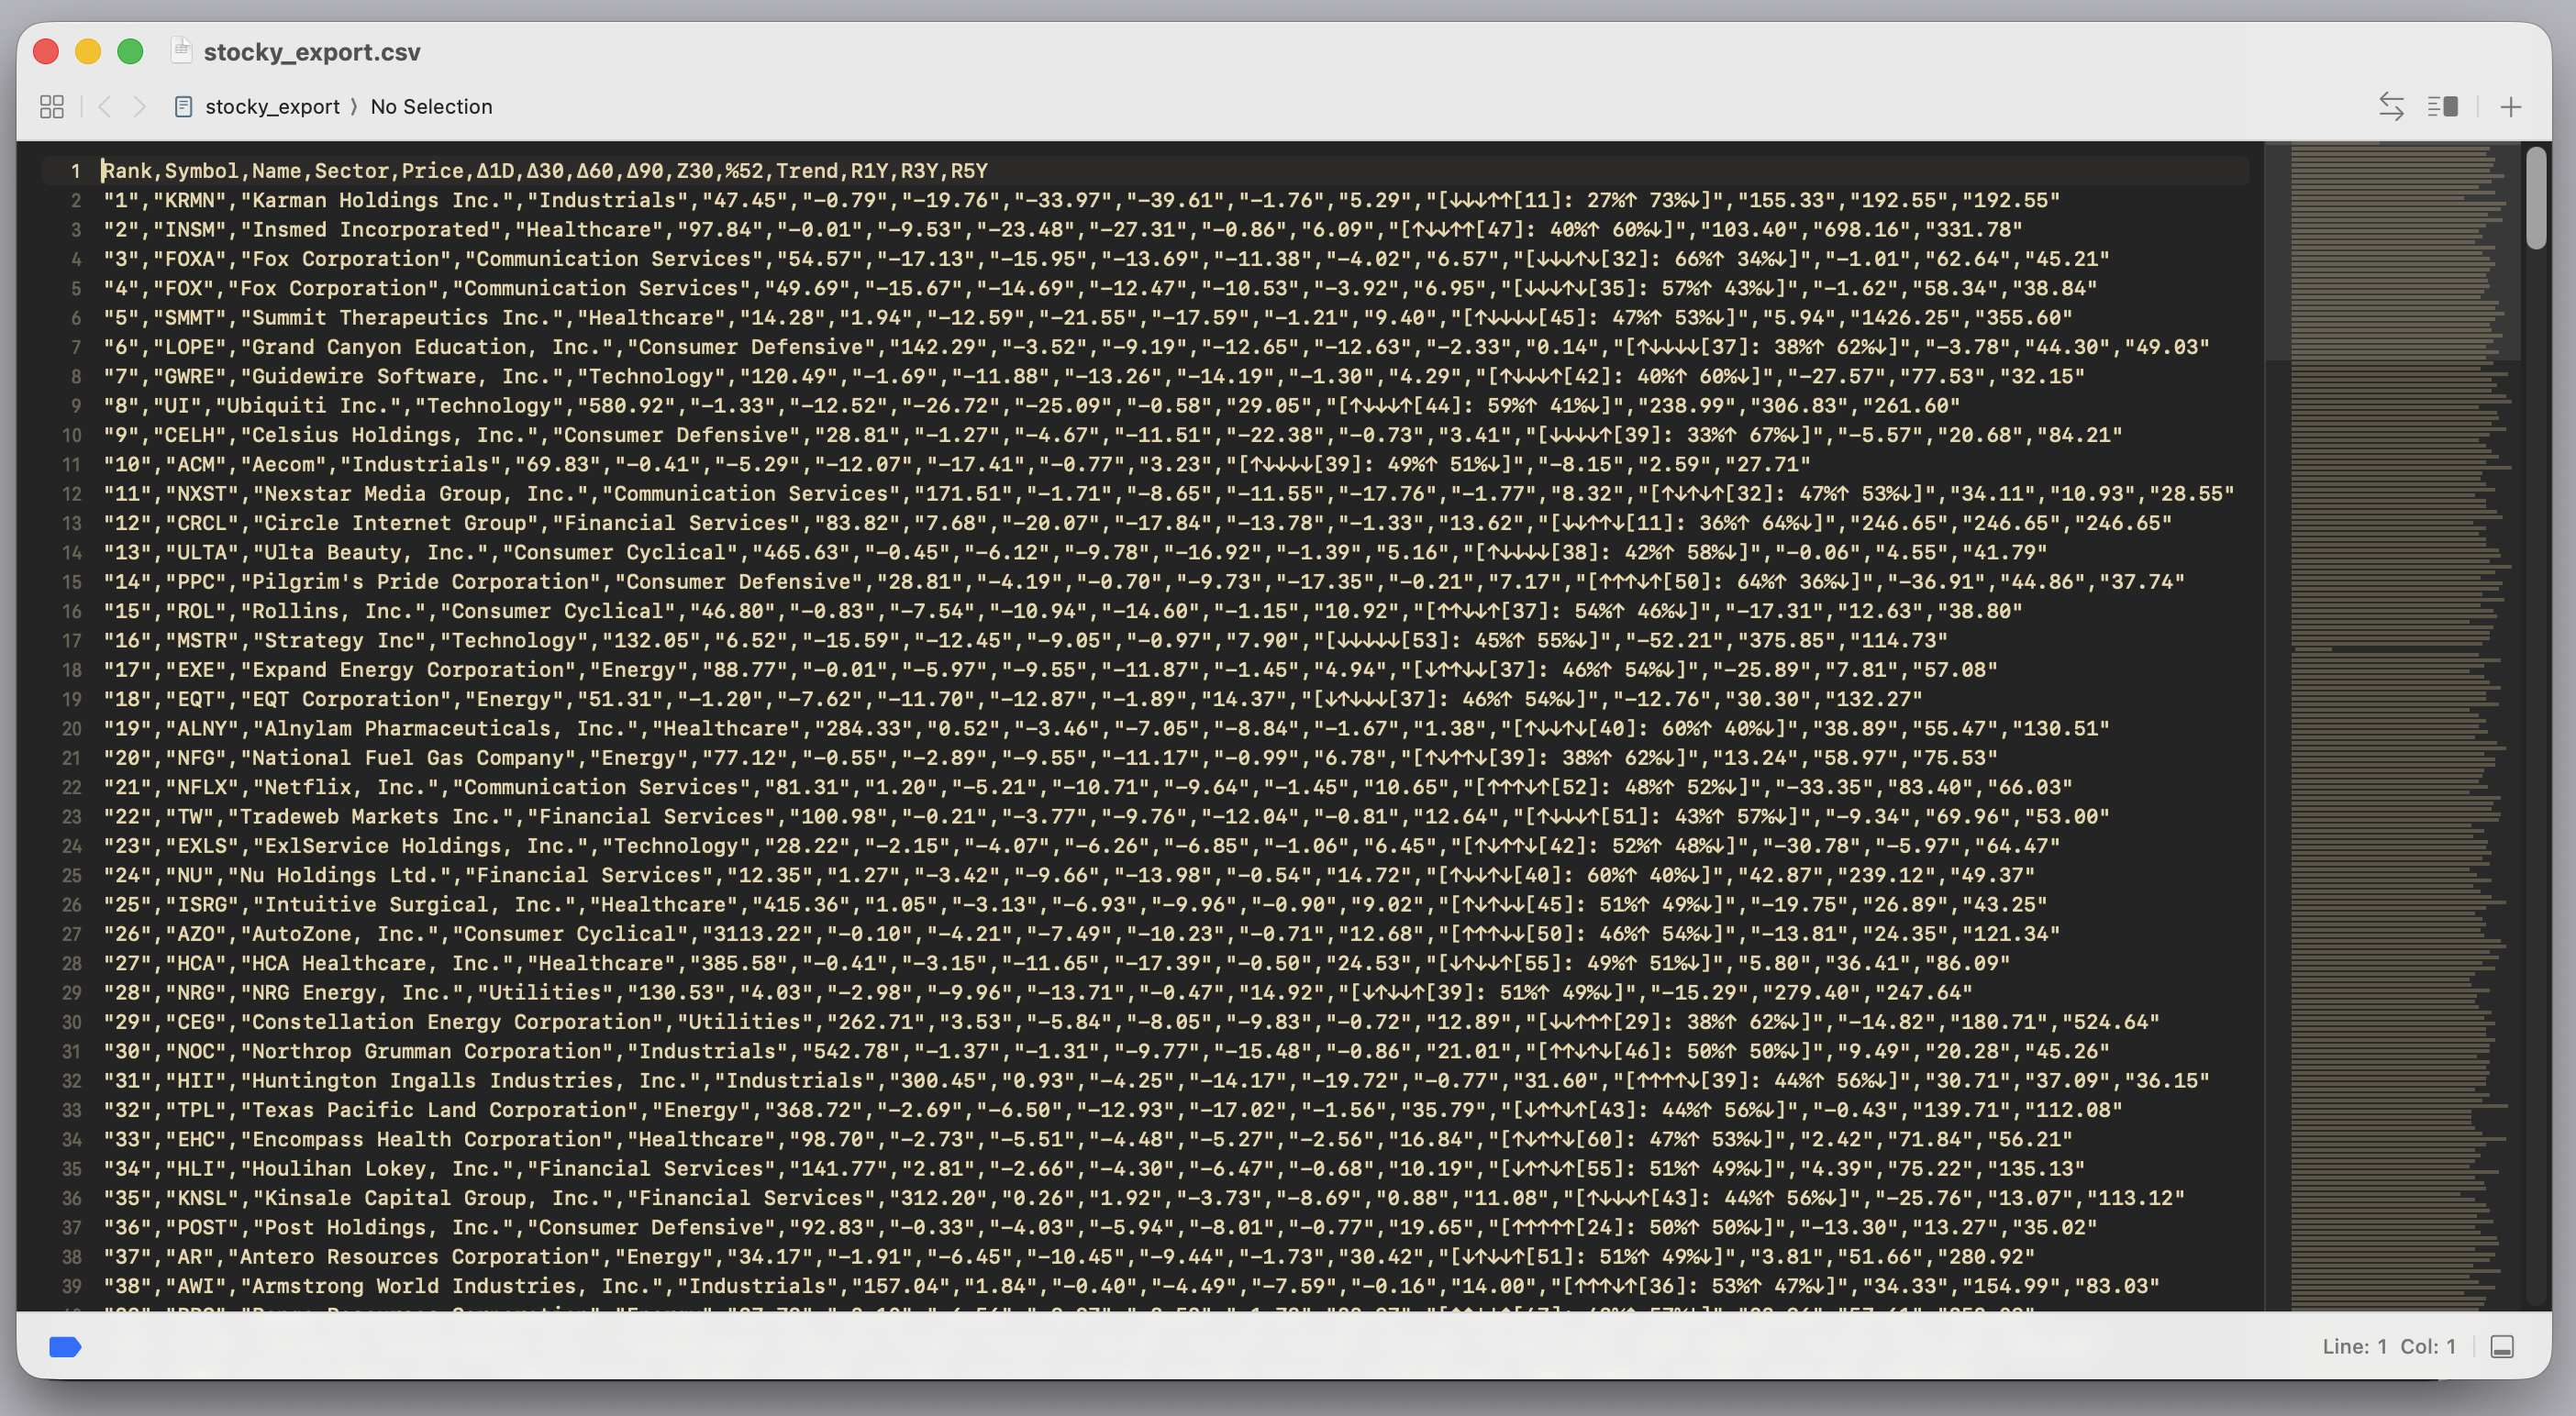
Adds the ability to export the current view as a vanilla .csv file, which can then be imported into other applications for further analysis, charting, custom reporting, or integration with external tools.
Read More →
Lists
May 20, 2026
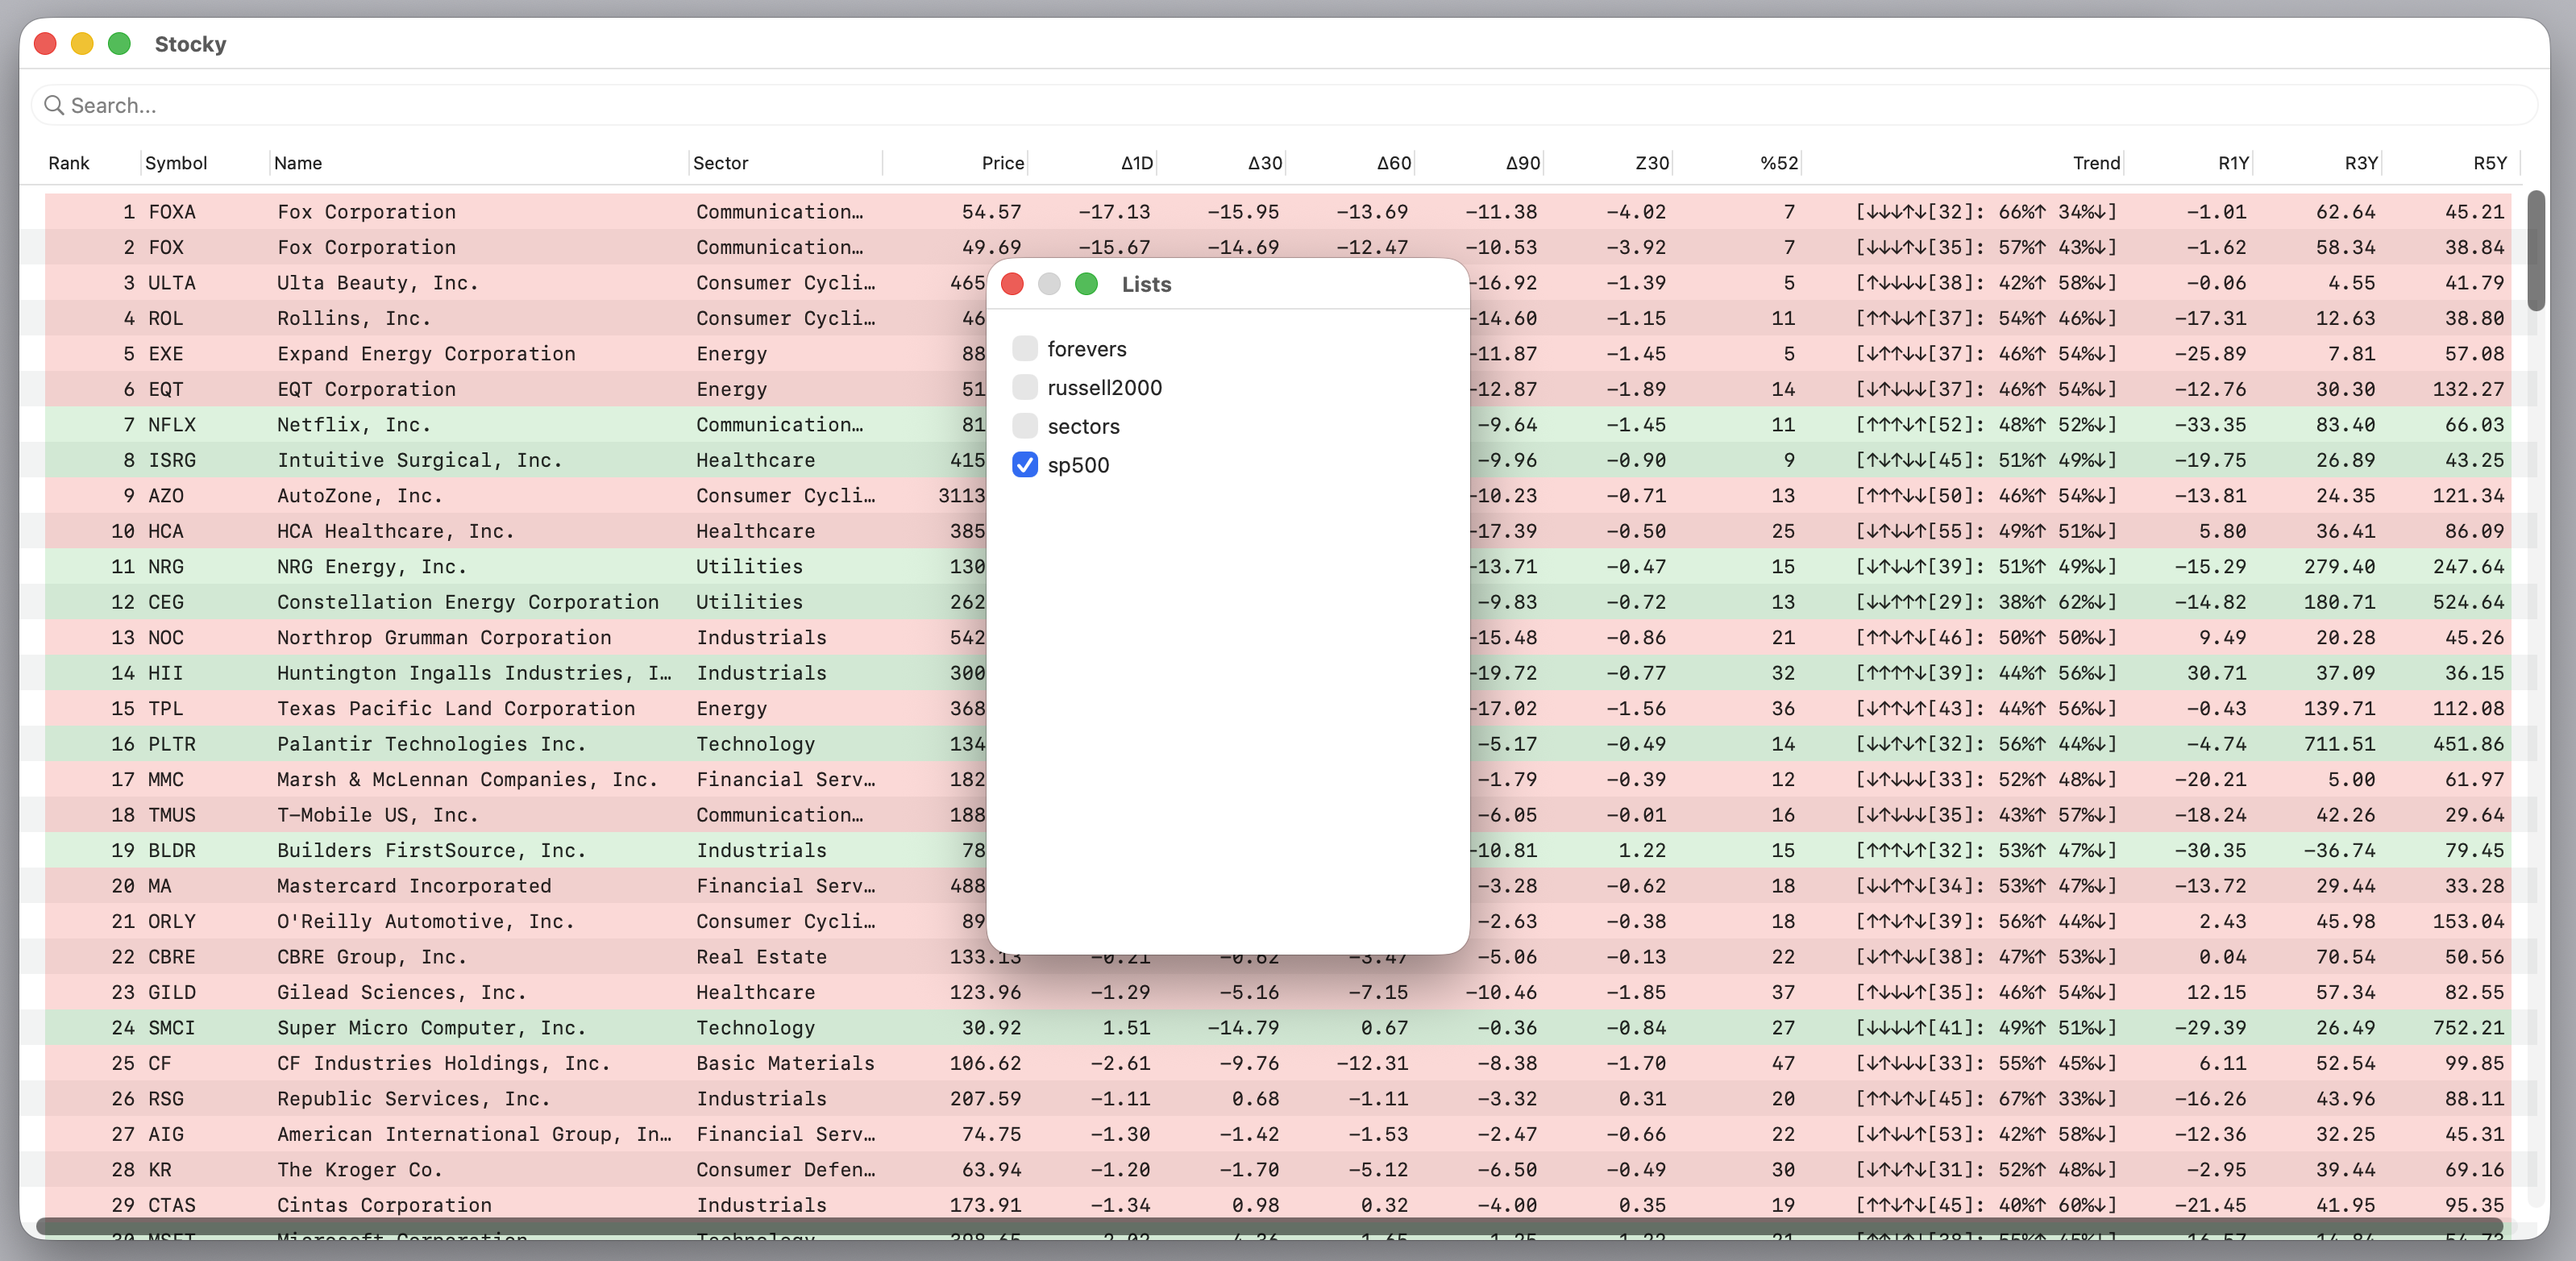
Added the ability to define lists of symbols that can be loaded / unloaded via the UI.
Read More →
Searching
May 16, 2026
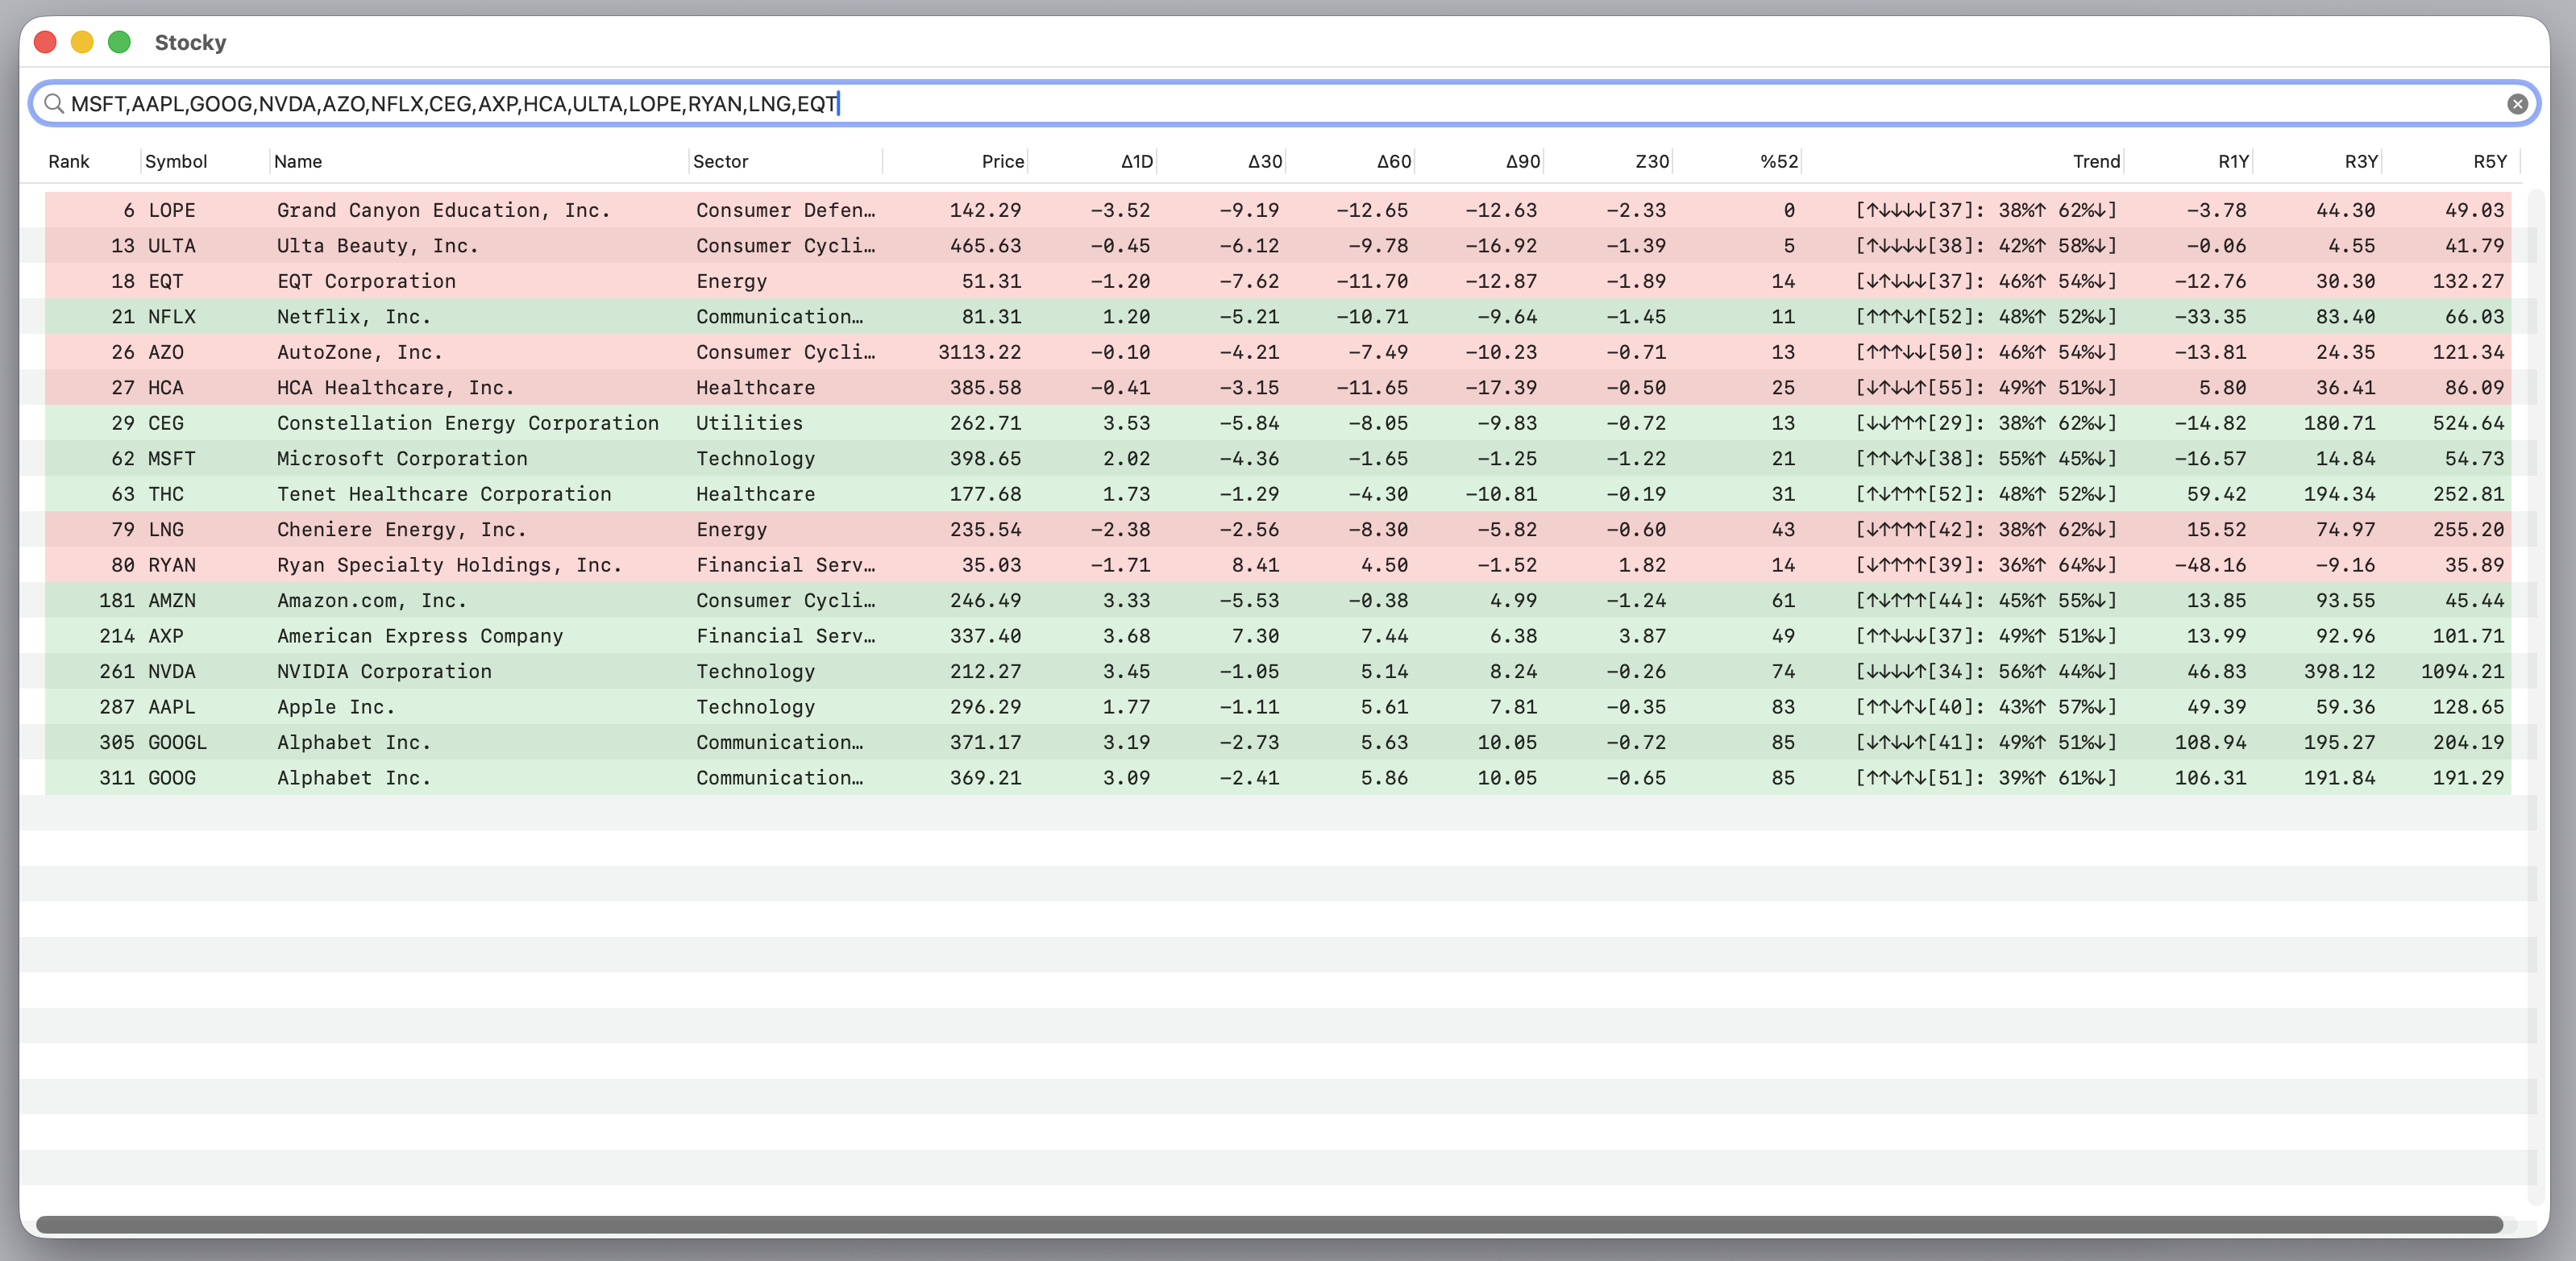
Searching is now supported, and additionally the search string can be comma separated to narrow the view down to show less instruments at a time and make the view less confusing.
Read More →
Colours First Cut
May 15, 2026
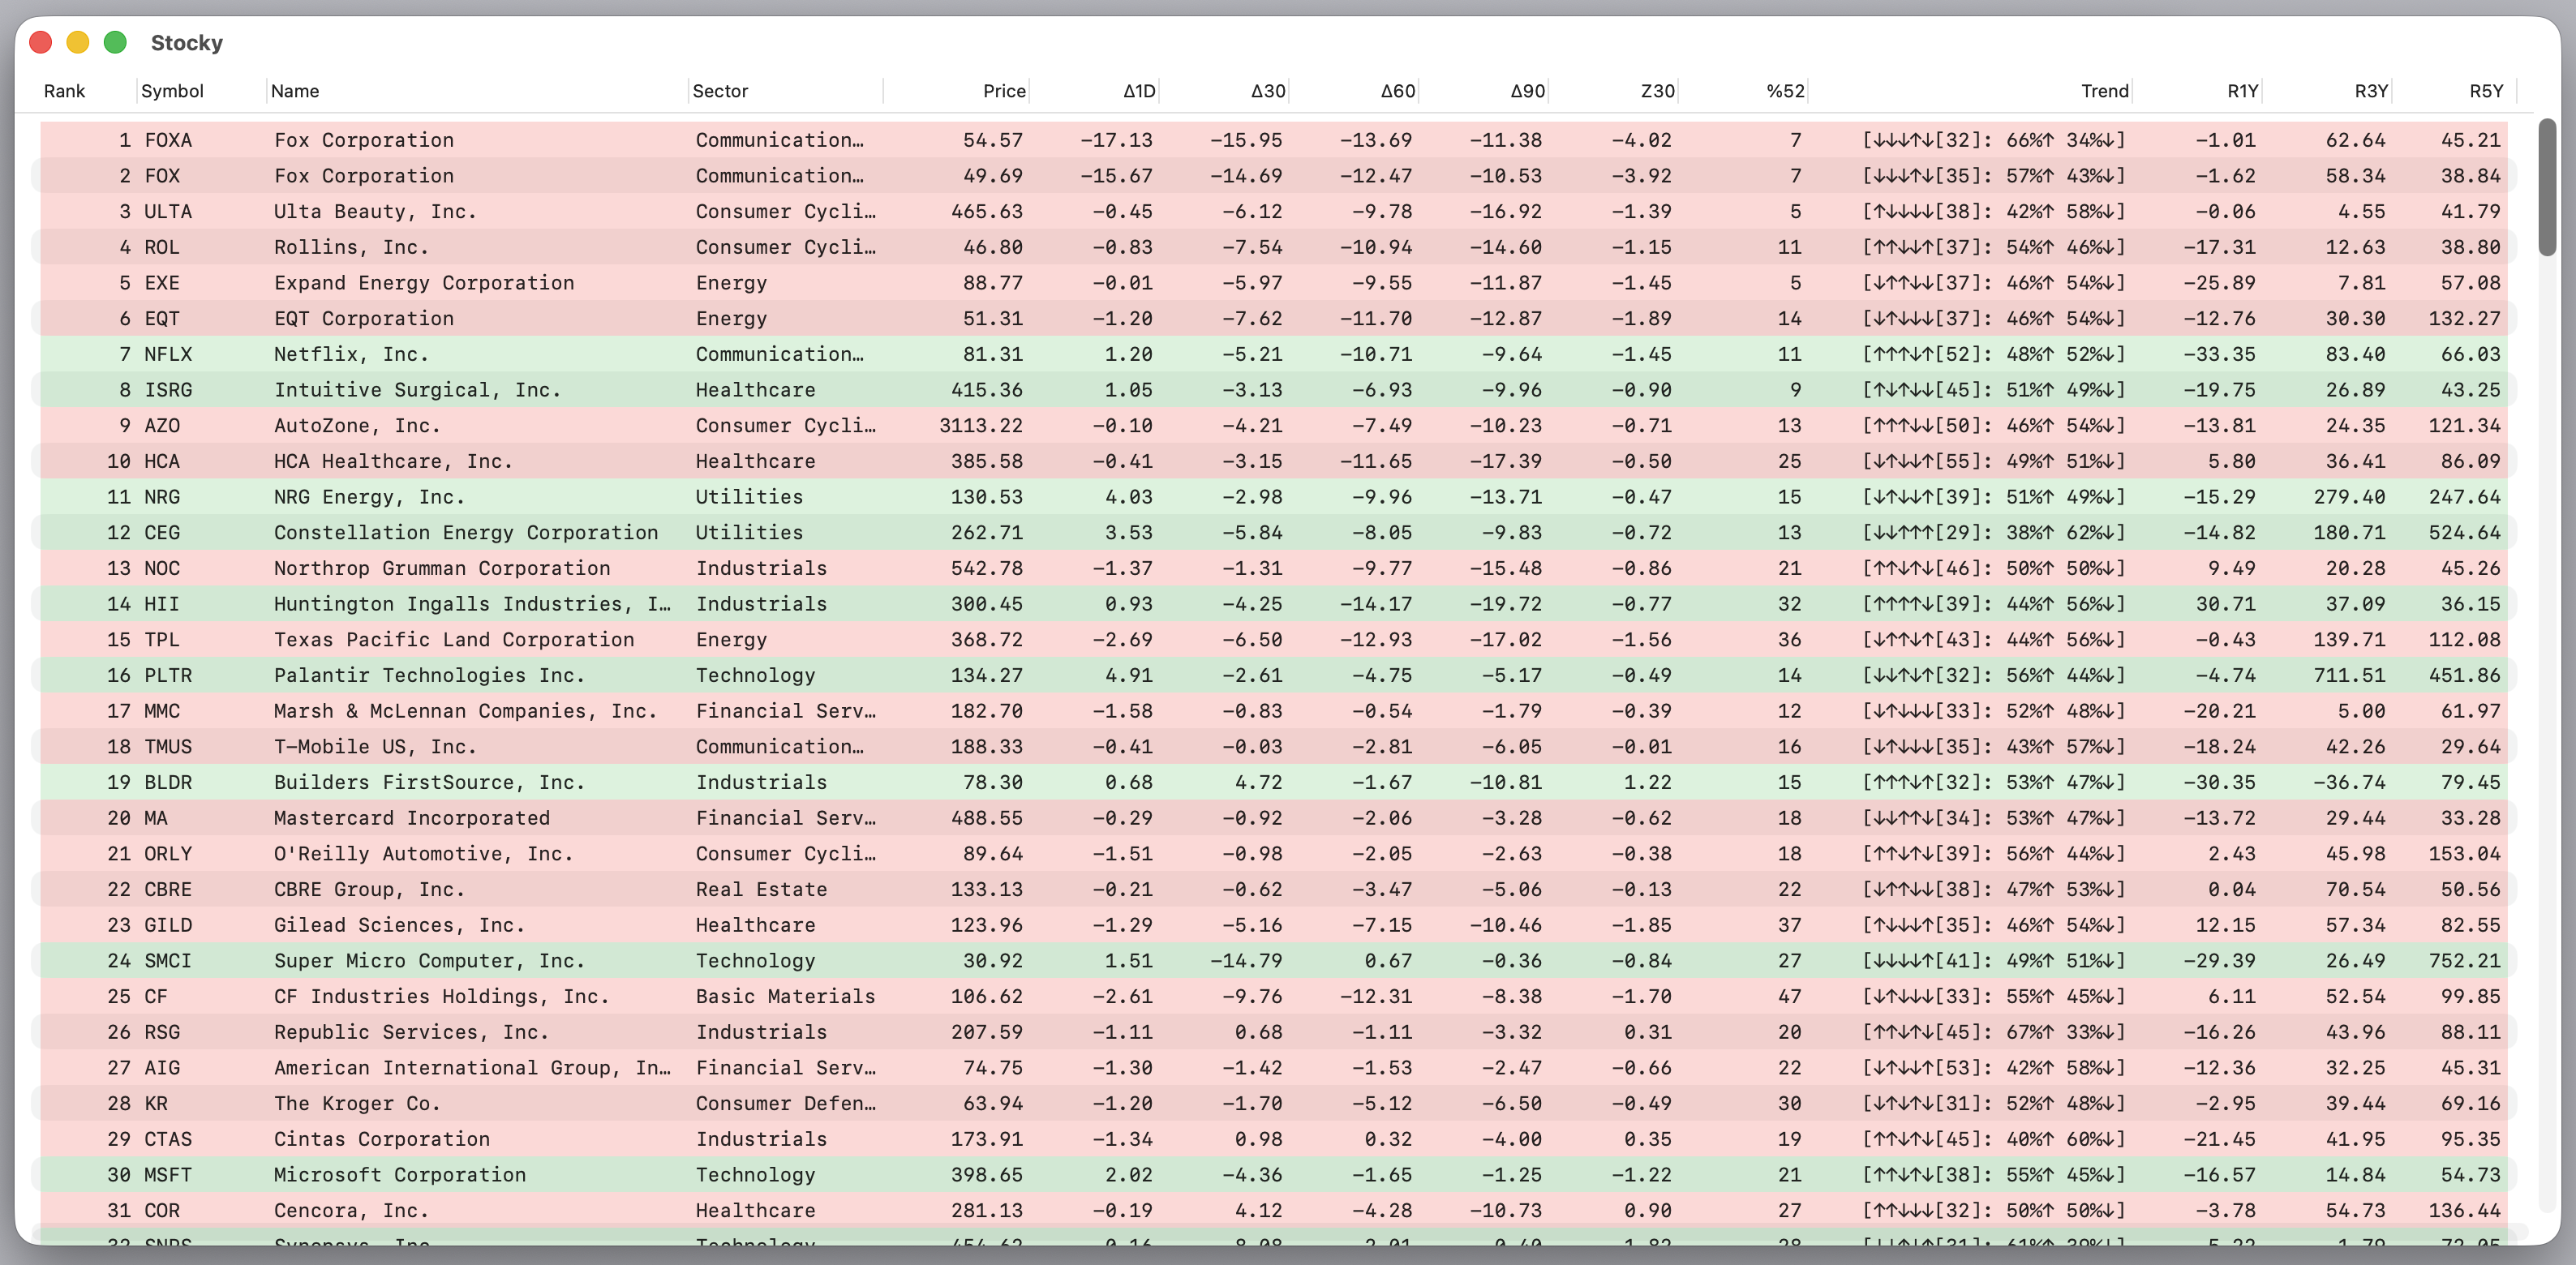
First cut at adding colour rendering to the table cells, indicating trend with colour.
Read More →
SwiftUI working
March 20, 2026
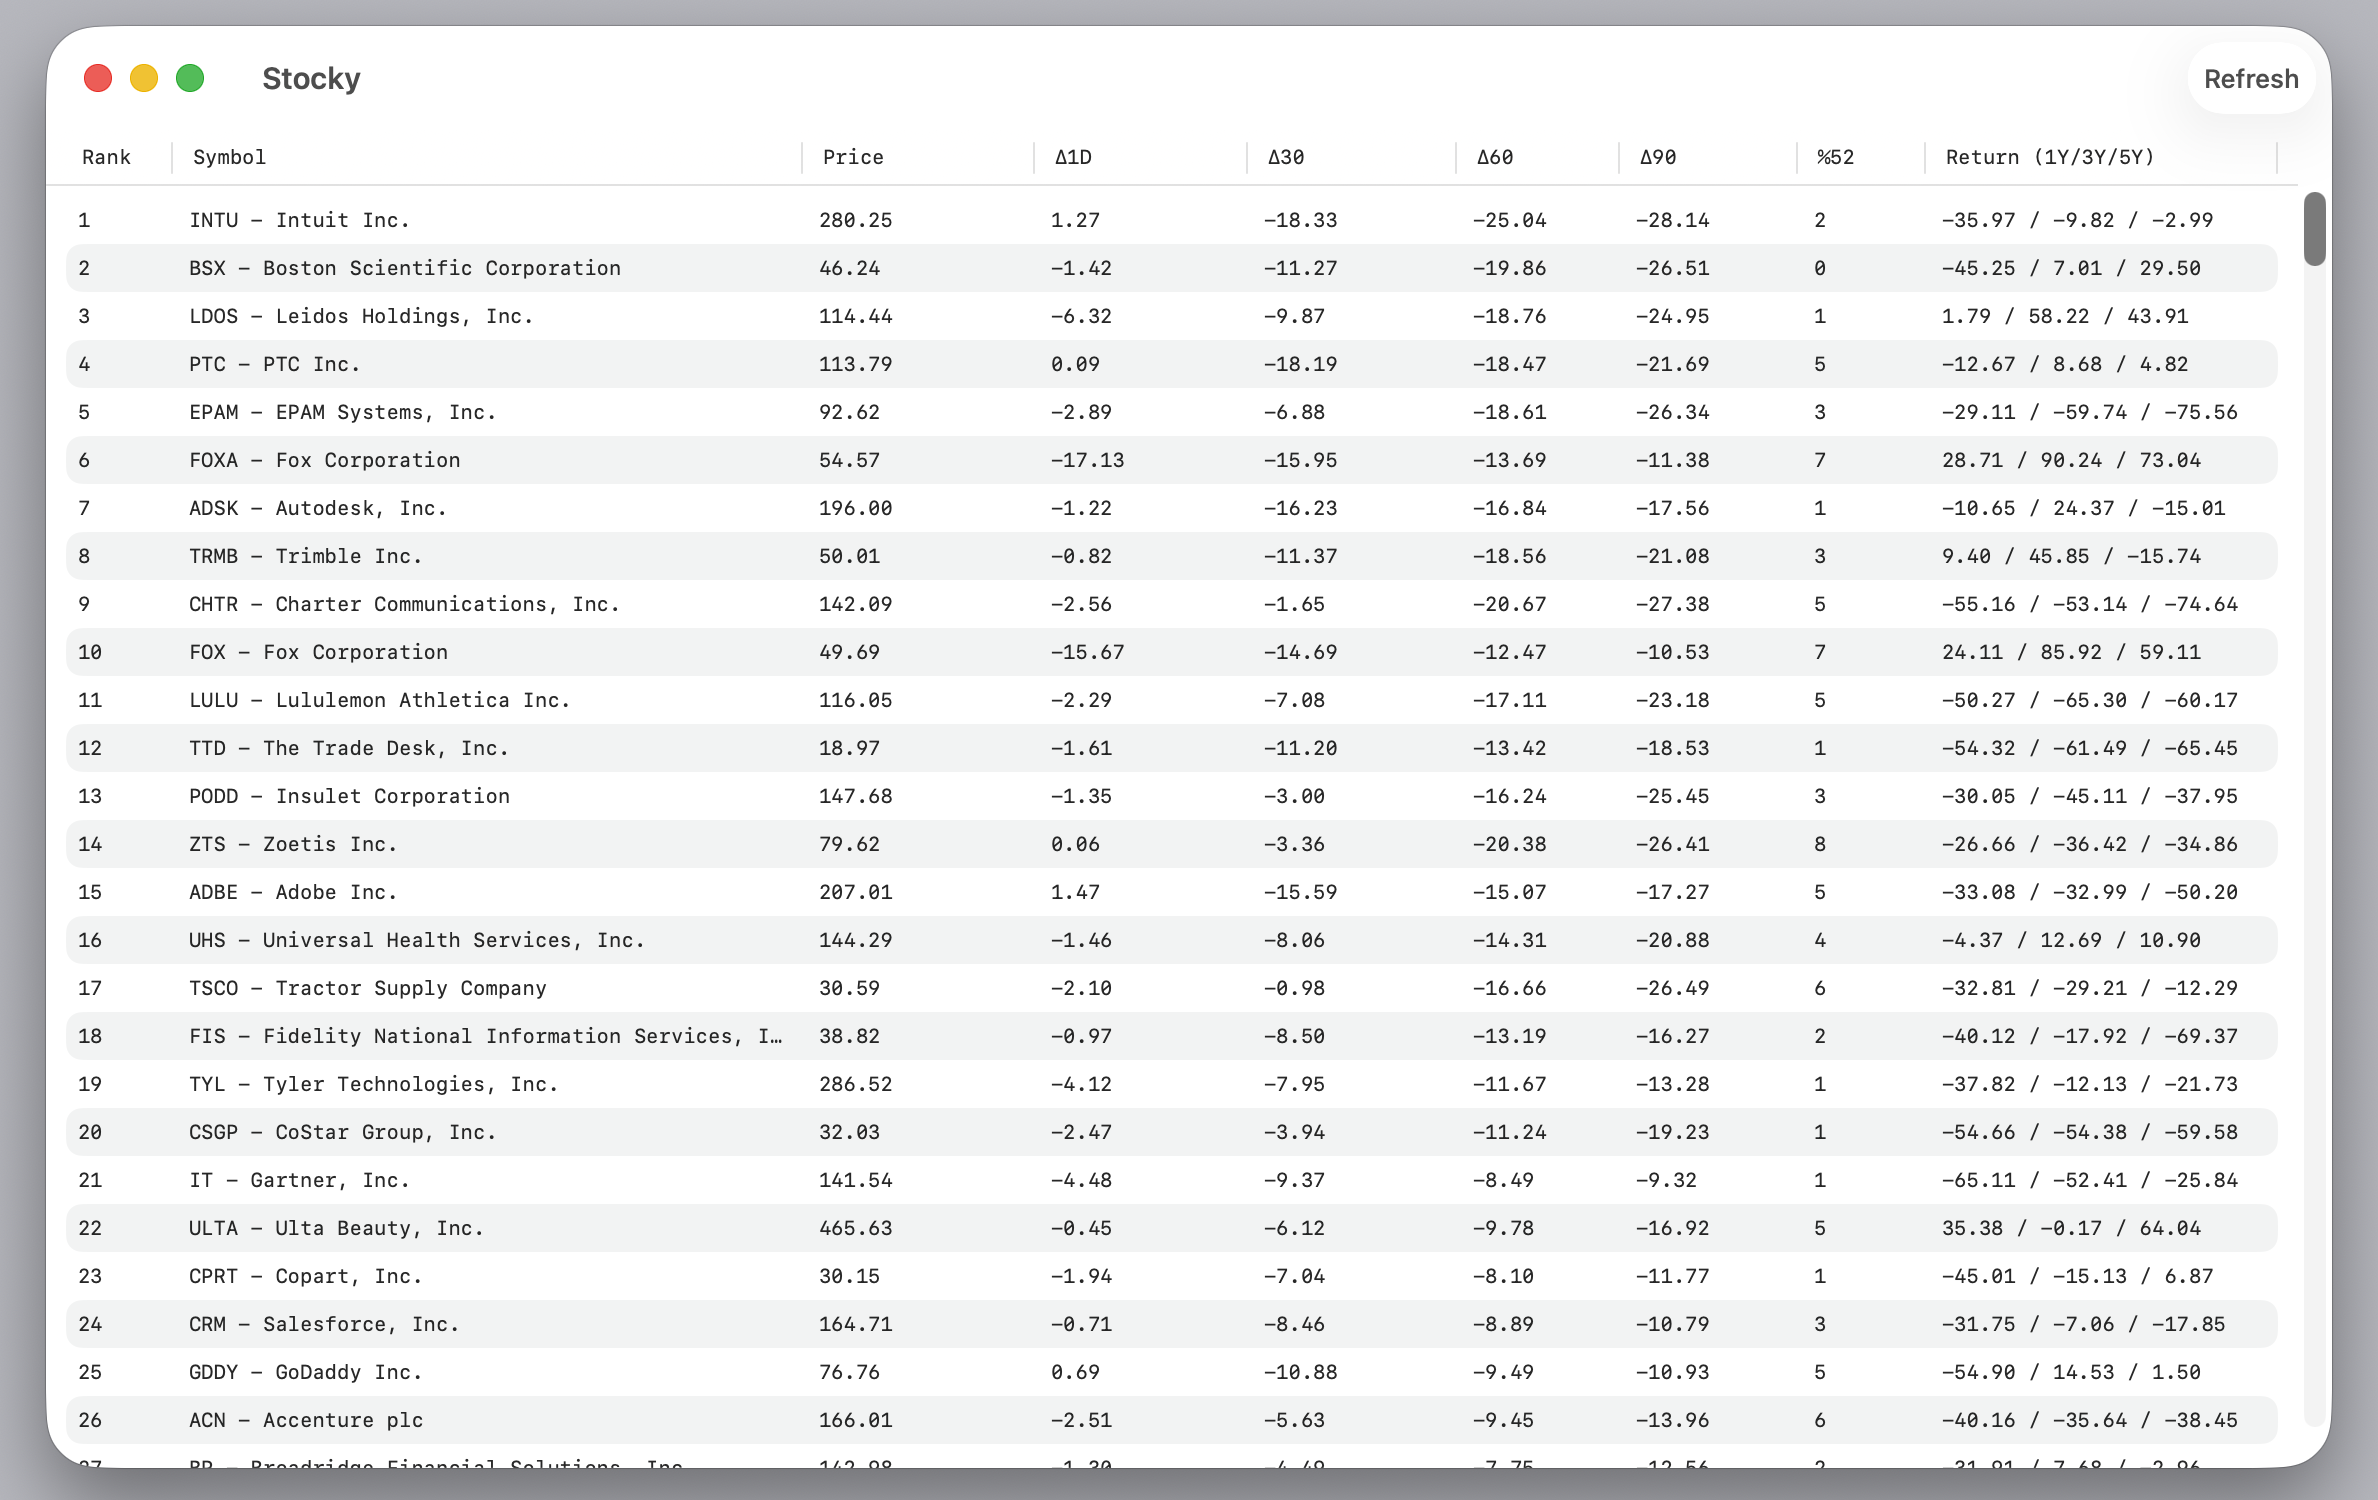
SwiftUI is working. Replaced all the original C++ backend with Swift, and connected to SwiftUI, so it's now natively rendering.
I did run into an issue with some SwiftUI limitations, mainly that the grid view is limited to 10 columns, which meant
…
Read More →
Directional Pattern Model
March 5, 2026
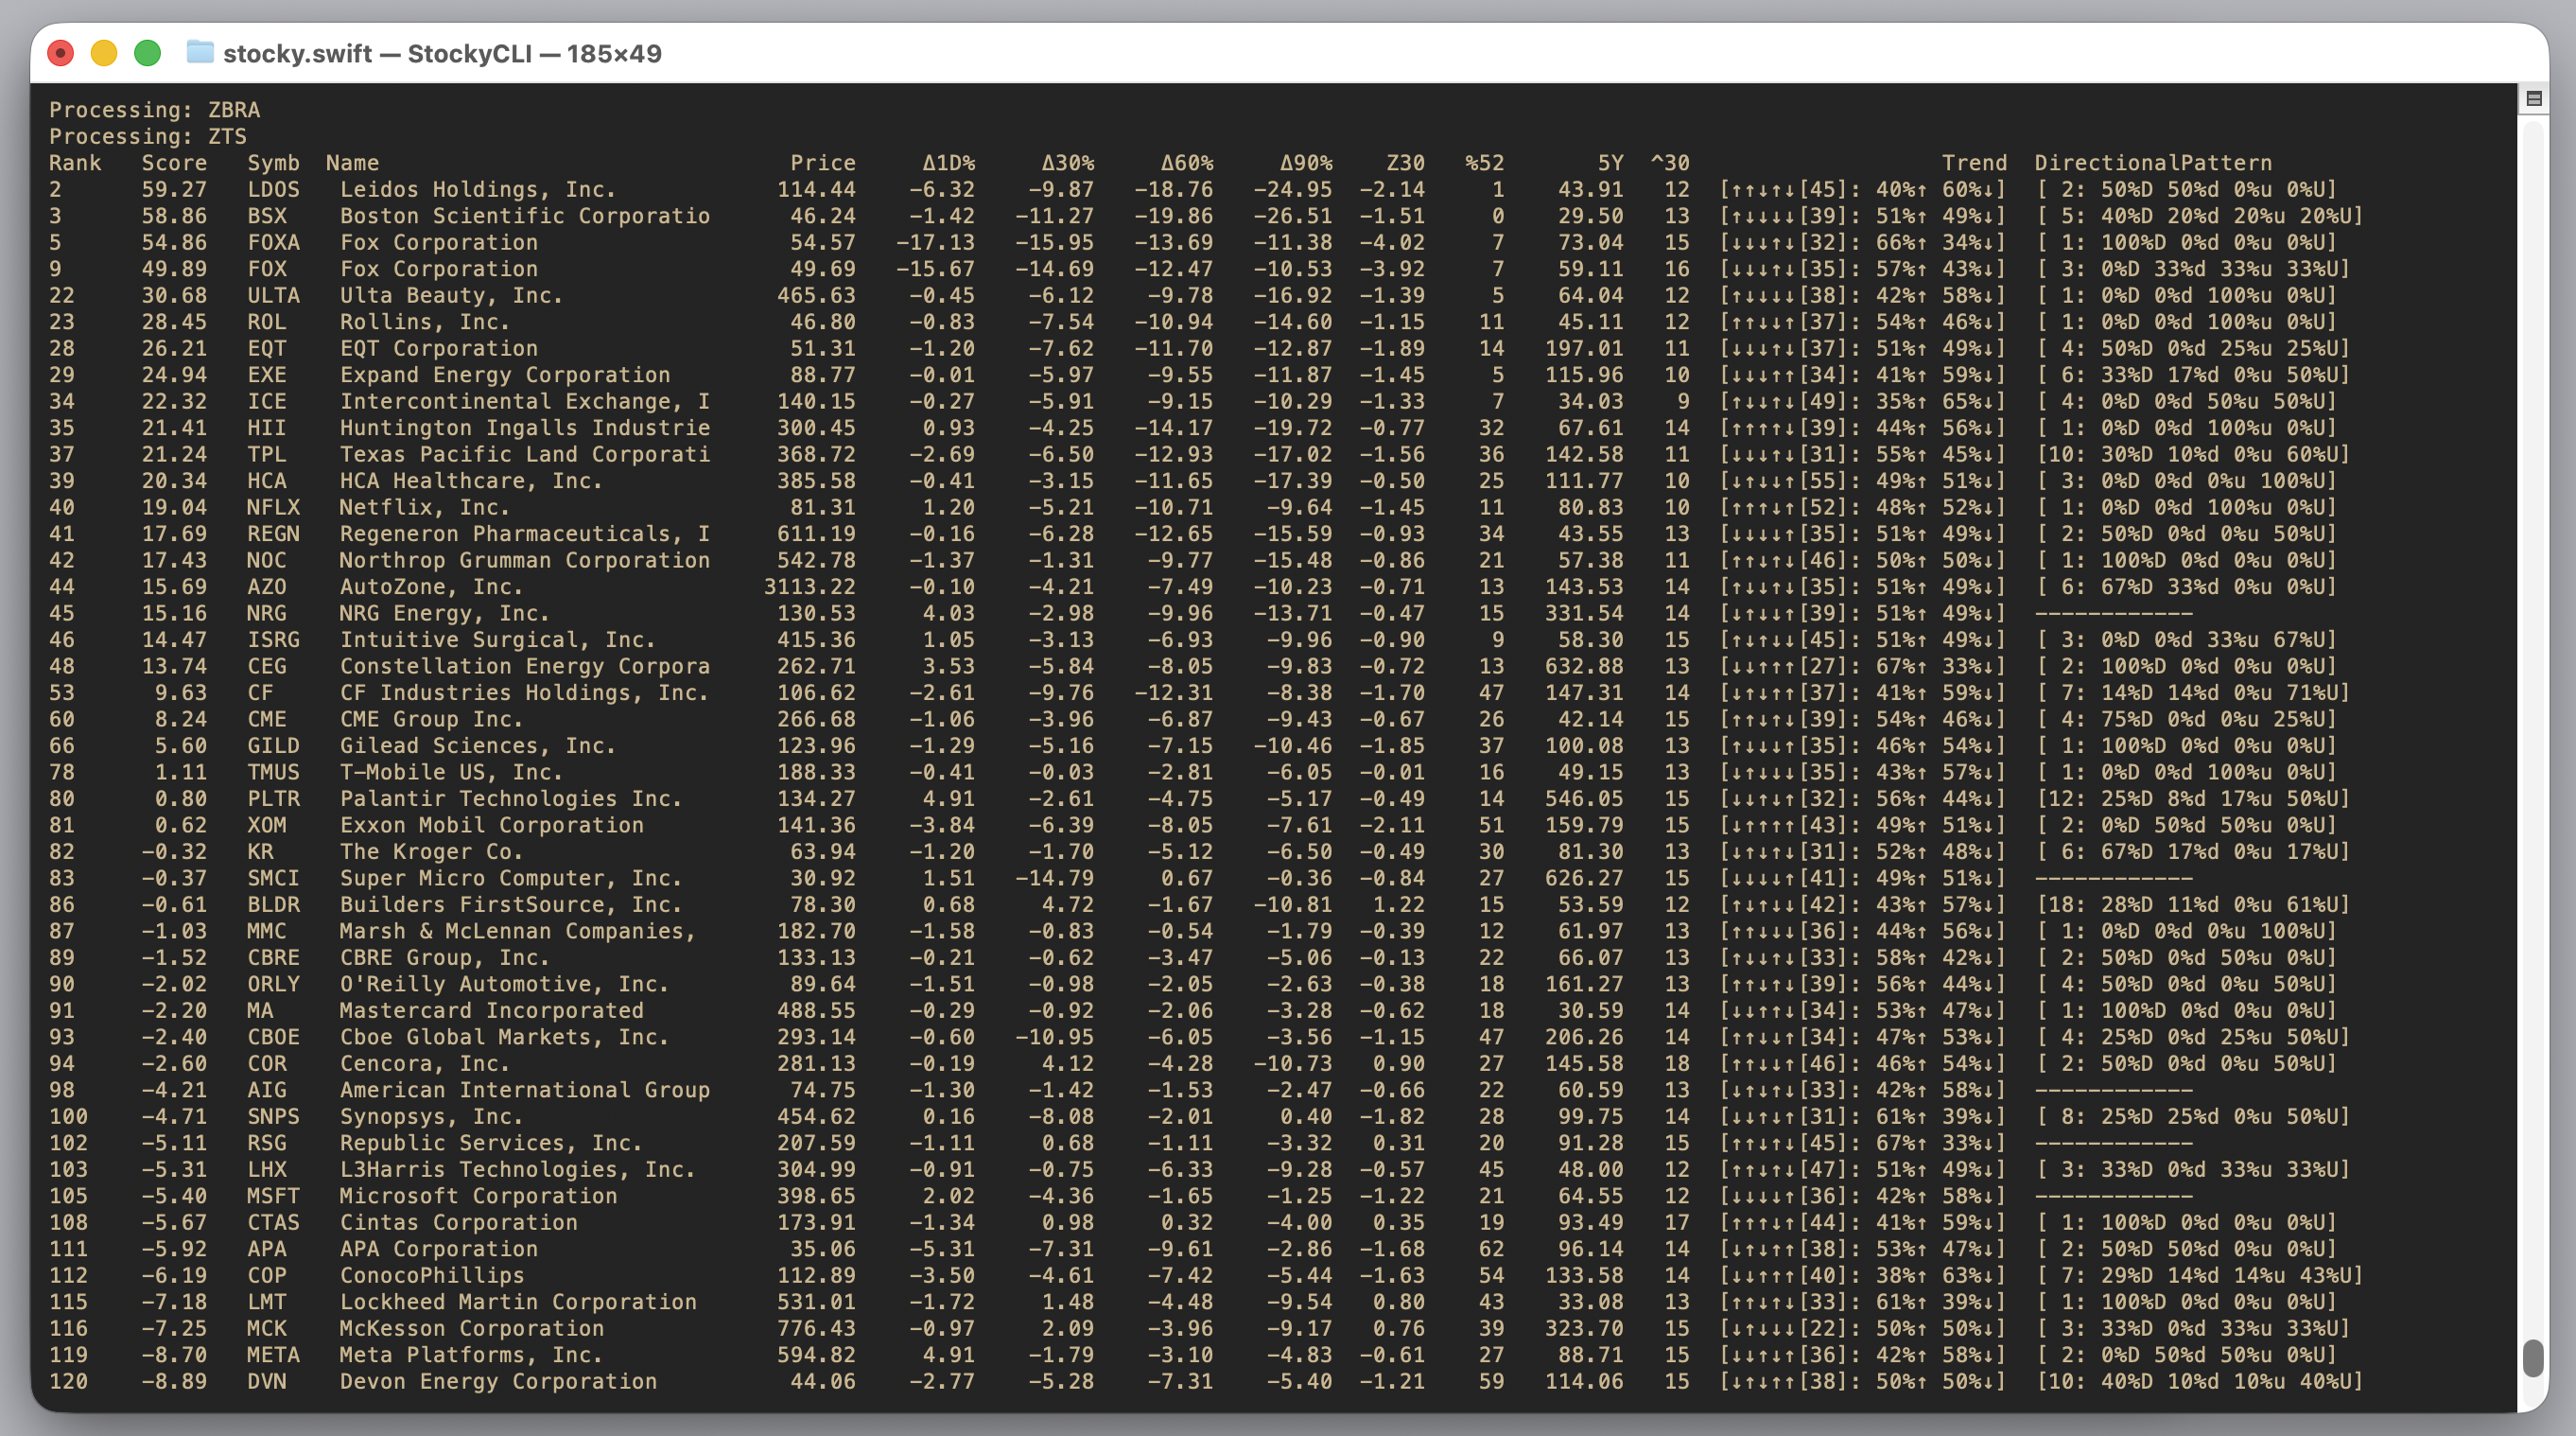
Directional Pattern Model
[10: 30%D 10%d 0%u 60%U]
The Directional Pattern Model is a variant of the existing Trend Pattern Model, except it adds more granularity. Instead of just tracking ups and downs, it tracks Big Ups and Big Downs and Small
…
Read More →
Trend Pattern Model
March 4, 2026
Trend
[↑↑↓↑↓[45]: 40%↑ 60%↓]
Experimenting with a trend pattern model. This is conceptually similar to a Markov chain in that it attempts to estimate the probability of the next state based on the current sequence of states. But it doesn't build
…
Read More →
Version 0.1
February 13, 2026
We are live. Currently is command line only and pretty much everything is hardcoded, but it can now fetch, rank and render 30, 60 and 90 day deltas, as well as trend and directional pattern model.
Investment instruments are inverse ranked using a w
…
Read More →